|
J Circ Biomark 2024; 13: 27-35 ISSN 1849-4544 | DOI: 10.33393/jcb.2024.3046 ORIGINAL RESEARCH ARTICLE |
A novel liquid biopsy assay for detection of ERBB2 (HER2) amplification in circulating tumor cells (CTCs)
ABSTRACT
Purpose: Circulating tumor cell (CTC)-based ERBB2 (HER2) assay is a laboratory test developed by Epic Sciences using single-cell genomics to detect ERBB2 (HER2) amplification in CTCs found in the peripheral blood of metastatic breast cancer (MBC) patients.
Patients and methods: Peripheral blood was collected in Streck tubes and centrifugation was used to remove plasma and red blood cells. The remaining nucleated cells were deposited on glass slides, immunofluorescent-stained with proprietary antibodies, scanned by a high-definition digital scanner, and analyzed by a proprietary algorithm. In addition, single-cell genomics was performed on selected CTC. Analytical validation was performed using white blood cells from healthy donors and breast cancer cell lines with known levels of ERBB2 amplification. Clinical concordance was assessed on MBC patients whose blood was tested by the CTC ERBB2 (HER2) assay and those results are compared to results of matched metastatic tissue biopsy (immunohistochemistry [IHC] 3+ or IHC2+/in situ hybridization [ISH+]).
Results: Epic’s ERBB2 (HER2) assay detected 2-fold ERBB2 amplification with 85% sensitivity and 94% specificity. In the clinical concordance study, among the 50% of the cases that had ERBB2 status results from CTCs found to be chromosomally-unstable, the CTC ERBB2 (HER2) assay showed sensitivity of 69% and specificity of 78% when compared to HER2 status by metastatic tissue biopsy.
Conclusions: The CTC ERBB2 (HER2) assay can consistently detect ERBB2 status in MBC cell lines and in the population of patients with MBC with detectable chromosomally unstable CTCs for whom tissue biopsy is not available or is infeasible.
Keywords: Analytical validation, Breast cancer, Circulating tumor cells, Epic CTC platform, HER2, Liquid biopsy
Received: February 14, 2024
Accepted: August 26, 2024
Published online: October 4, 2024
This article includes supplementary material
Journal of Circulating Biomarkers - ISSN 1849-4544 - www.aboutscience.eu/jcb
© 2024 The Authors. This article is published by AboutScience and licensed under Creative Commons Attribution-NonCommercial 4.0 International (CC BY-NC 4.0).
Commercial use is not permitted and is subject to Publisher’s permissions. Full information is available at www.aboutscience.eu
Introduction
ERBB2 genomic amplification is a cancer driver occurring in approximately 20% of breast cancer patients (1). Several pharmacological strategies are designed to be efficacious against cancers with HER2 tumor-specific overexpression (1). Clinically established routine tissue biopsies detect HER2 overexpressed or ERBB2 “amplified” HER2 by detecting the number of copies of ERBB2 by in situ hybridization (ISH) or by protein overexpression by immunohistochemistry (IHC) (2-4).
During the initial diagnosis of metastatic cancer, the standard of care is to verify concordance of current HER2 status with the primary tumor by performing a tissue biopsy on the first or most available metastatic site. Previous studies of metastatic breast cancer (MBC) patients have demonstrated a degree of tumor tissue heterogeneity (5-12) and discordance in the HER2 status between metastatic sites and the primary tumor (13-15). Lack of knowledge about potential change in HER2 status may increase the chance that the therapy for patients thought to continue to have HER2-positive MBC will be ineffective at the expense of toxicity. At the same time, patients with a change to HER2-positive status may miss out on an effective treatment. The occurrence of receptor conversion makes longitudinal monitoring important, yet it is challenging to implement due to the invasive nature of tissue biopsies. While assessment of HER2 status through tissue biopsy IHC or ISH is the standard of care, a significant population of MBC patients do not receive an assessment of HER2 status and even fewer receive serial longitudinal tissue biopsies (16-18). As a result, tumor evolution and biomarker receptor conversion, which can contribute to treatment resistance, are often missed. Studies are ongoing to assess whether HER2 receptor conversion impacts treatment efficacy and survival.
When tissue biopsy is contraindicated, refused, or otherwise not available, liquid biopsy can be an alternative. Typical liquid biopsy assays are limited to analysis of only the cell-free deoxyribonucleic acid (cfDNA) component of blood. In contrast, Epic Sciences’ liquid biopsy assay identifies candidate circulating tumor cells (CTCs), confirms they are genomically unstable, and assesses ERBB2 amplification within those selected cells. CTCs are very rare (on the order of one in two million cells), making both their detection and analysis challenging. Historically, the detection of CTCs relied on enrichment techniques based on preconceived knowledge about their biological phenotype, which may not account for evolving and emerging CTCs. Enrichment limits the ability to perform standardized clinical pathology for CTC biomarker assessment (morphology, protein, and molecular identification) on individual isolated cells (19-23). To overcome these limitations, Epic Sciences developed a cell-based assay to analyze the entire population of blood cells from a tube of blood providing a broad and unbiased identification of CTCs. Epic’s assay then performs a thorough and high-definition phenotypic assessment, which includes evaluation by a clinical pathologist of cell morphology and immunofluorescence (IF) protein expression. A subset of CTCs is also selected to obtain genomic data matching cell morphology and IF data.
Using the cell-based assay (24), Epic Sciences previously developed an assay for detecting AR-V7-positive CTCs in patients with metastatic castration-resistant prostate cancer and informing the selection of treatment associated with superior survival on taxane therapy over androgen receptor signaling inhibitor-directed therapy (25-33). Epic’s AR-V7 test was approved by MolDX (Molecular Diagnostic Services Program) for Medicare reimbursement. Epic’s CTC ERBB2 assay expands Epic’s core technology to detect ERBB2 amplification in CTCs from patients with MBC in a multistep workflow. This report describes both the analytical validation and clinical concordance studies that Epic Sciences completed to assess the performance of the CTC ERBB2 Assay.
Methods
CTC ERBB2 assay workflow
Epic’s CTC ERBB2 assay workflow is shown in Figure 1 (further described in the Supplementary methods section). The assay uses a non-enrichment approach where all nucleated blood cells from a patient are placed on microscope slides (24). The slides are stained by IF and scanned by a high-definition imaging system. The image data are analyzed by an algorithm to detect CTC candidates from among the approximately three million white blood cells (WBCs) on each slide (Fig. 1). To minimize the manual cell classification effort, Epic developed an image analysis algorithm, BRIA (Breast Cancer Imaging Algorithm), to improve standardization and scalability of the assay. BRIA excludes the majority of the non-CTCs and identifies CTC candidates. The identified CTC candidates and their coordinates are tracked through the entire workflow from IF cell analysis to genomics. Using an in-house-developed Clinical Viewer for classification, interpretation, and reporting, CTC candidates are manually classified and confirmed by trained, California-licensed clinical laboratory scientists (Figs. 1 and 2).
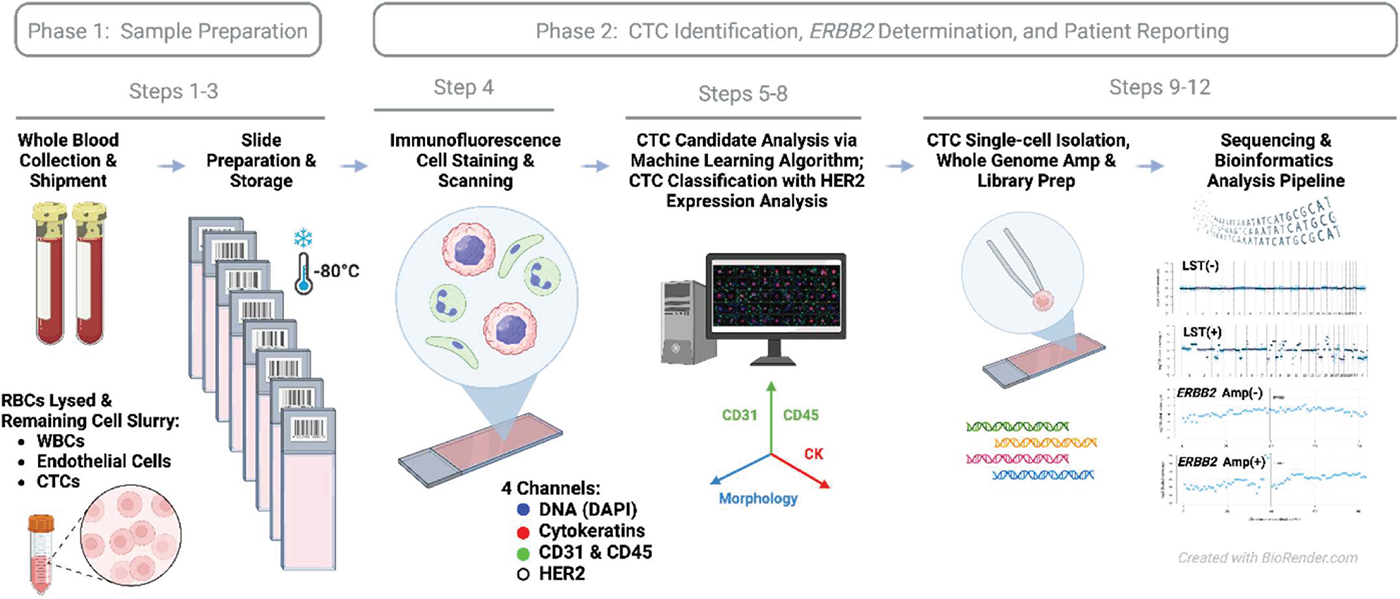
FIGURE 1 - Workflow of Epic Sciences’ CTC ERBB2 assay. The assay is performed entirely at Epic Sciences’ CAP/CLIA laboratory. After deposition of blood cells onto glass slides, CTC candidates are identified through an immunofluorescence-based (IF) assay, then the laboratory director (a board-certified clinical pathologist) selects cells for genomic characterization via single-cell isolation and low-pass whole-genome sequencing by prioritizing those with higher MFI readings in the HER2 channel. Step numbers correspond to the workflow as described in Supplementary methods. CTC = circulating tumor cell; MFI = median cellular fluorescence intensity.
Following CTC classification, the laboratory director (a medical doctor and board-certified clinical pathologist) reviews the CTC candidates and, by prioritizing CTCs with high HER2 IF staining intensities, selects CTCs for further genomic characterization via single-cell isolation and low-pass whole-genome sequencing (24,34) for detection of ERBB2 amplification and chromosomal instability. DNA extraction from the CTCs is done via cell lysis, Proteinase K, and Tris buffer. Sequencing library preparation comes after whole-genome amplification (WGA). Both WGA and library preparation are done with the Sigma-Aldrich SEQPLEX-I WGA kit. Patient-level ERBB2 status is determined based on assessment of ERBB2 amplification levels across the chromosomally unstable CTCs using a clinical decision tree scoring system (Fig. 3). The board-certified pathologist(s) at Epic use Epic’s Clinical Viewer to review QC data, interpret the results, and generate the clinical report.
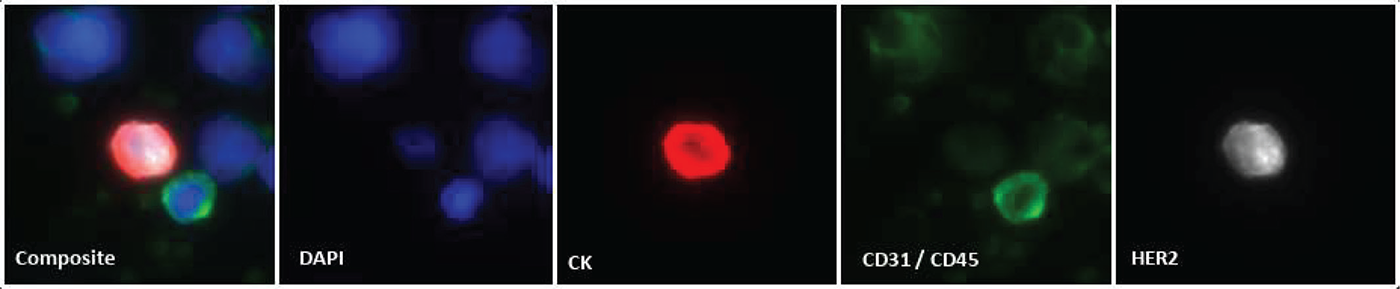
FIGURE 2 - Example HER2 protein expression visualized by immunofluorescence. Immunofluorescence staining of a CTC and surrounding cells as tested on Epic’s CTC detection assay. The composite image is the overlay of four distinct fluorescent channels demonstrating the identification of nuclear DNA (DAPI, blue), pan-cytokeratins (CK, red), endothelial (CD31) and white blood cell (CD45) markers (green), and HER2 protein (white). The CTC shown expresses marked levels of CK and HER2, yet lacks the presence of CD31/CD45 protein markers. Image shown is 40× magnification. CTC = circulating tumor cell; DAPI = 4′,6-diamidino-2-phenylindole; DNA = deoxyribonucleic acid.
CTC immunofluorescence
The CTC HER2 test utilizes a 4-channel IF assay workflow as outlined in Figure 1. Centrifugation facilitates plasma separation from red blood cells (RBCs). Following removal of plasma, RBCs are lysed, and the remaining nucleated cells are deposited on glass slides and adhered to microscope slides at a density of approximately 3 × 10⁶ cells per slide and stored at −80°C prior to testing. To begin, the IF assay slides are thawed, proteins fixed with paraformaldehyde, cell membranes permeabilized via methanol treatment, washed and placed in automated slide staining instrument. Each slide is subjected to nuclear staining with 4′,6-diamidino-2-phenylindole (DAPI), as well as staining with fluorescently labeled antibodies specific to CD45 (WBC marker), CD31 (endothelial cell marker), cytokeratins (CKs; CTC marker), and HER2 through a sequential immunoassay workflow. CD31 (marking endothelial cells) and CD45 (marking WBCs) are exclusionary labels that allow us to filter out the endothelial cells and WBCs. DAPI channel is used for nuclear staining. The anti-pan CK antibody detects multi-CK types within the 555 nm channel as a marker for tumor cells. The Tyramide Signal Amplification (TSA) reagent system is used to generate the signal detected at 488 nm for the HER2 biomarker. Following fluorescent slide scanning image analysis is performed through BRIA.
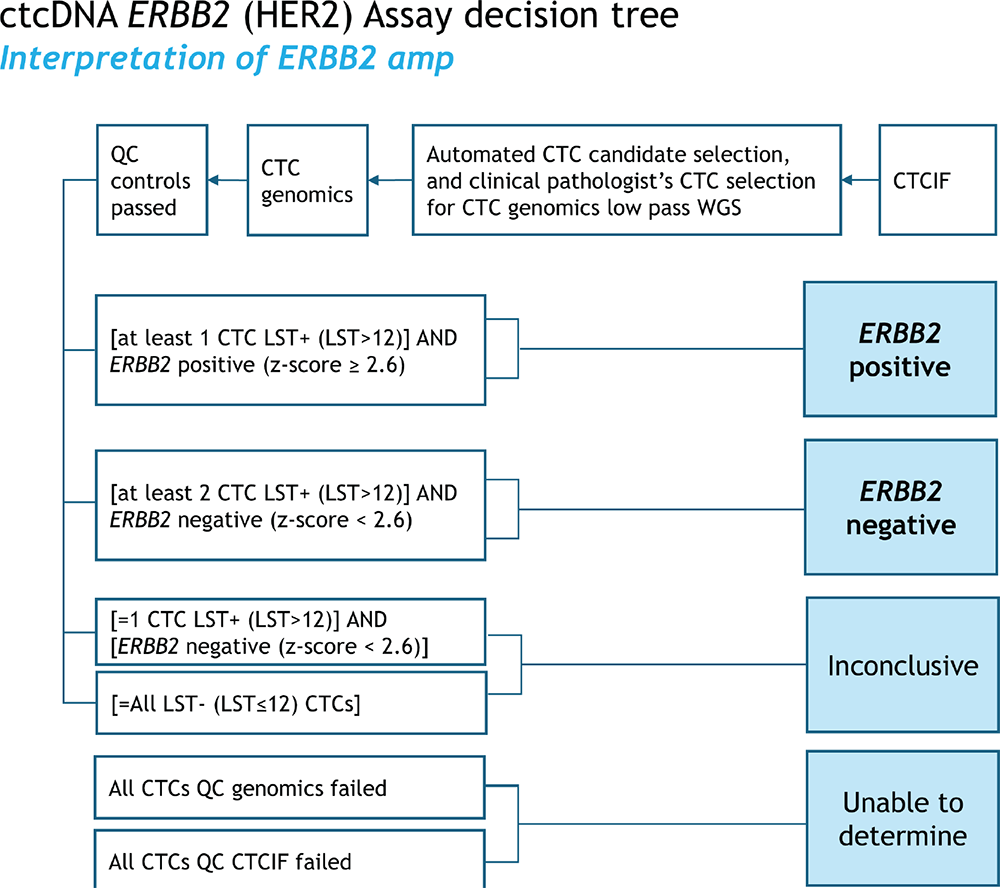
FIGURE 3 - Clinical scoring decision tree for Epic’s CTC ERBB2 (HER2) assay. CTCs that fail genomics QC metrics are excluded from the analysis. If the resulting ERBB2 Z-score is ≥2.6 on at least one CTC and at least one LST+ CTC (LST > 12) is present, the case is positive. The case is negative if the resulting ERBB2 Z-scores are <2.6 and at least two LST+ CTC (LST > 12) are present. The result is inconclusive if all CTCs are LST− (LST ≤12) or if the ERBB2 Z-scores are <2.6 and only one LST+CTC (LST > 12) is present. However, If the patient sample is deemed “Inconclusive,” additional CTCs may be prioritized and selected for sequencing, if available. The case is “unable to determine” if no CTCs are available for further analysis. CTC = circulating tumor cell; LST = large-scale state transition.
Breast cancer imaging algorithm
BRIA consists of four main components: cell detection, segmentation, feature extraction, and CTC candidate identification. BRIA’s cell detection and segmentation components were leveraged from its predecessor (24) used for AR-V7, with the addition of 42 newly developed image intensity features. BRIA’s input is a high-resolution image from the ZEISS™ Axio automated scanning platform. BRIA first detects cells with DAPI signal. A multiscale feature enhancement algorithm is used to detect edges and blobs that are defined using the DAPI signal to enable detection of cell centers. The detected cells are further computationally characterized to extract relevant features from the biomarker intensity data in each of the channels (DAPI, CKs, CD45, and CD31). Specifically, there are 9 cell morphology, 42 biomarker signal intensity, and 24 image texture features. The feature values are used as input to the machine-learning generated algorithm that identifies CTC candidates for manual review.
Copy number variation pipeline for ERBB2 and large-scale state transition detection
A copy-number-analysis pipeline was developed for analysis of the CTC sequencing data. The pipeline was previously described and is similar to typical whole-genome sequencing workflows (35). Briefly, it aligns the Illumina sequencing reads to the human reference genome (hg38) and tallies the read coverage of 1-Mb bins across the genome. Using the alignment data, it computes key bioinformatic QC metrics for identifying samples with 1) insufficient sequencing data, 2) significant fractions of low-quality alignments, or 3) excessive coverage noise. Samples not passing bioinformatic QC are excluded from analysis (counts shown in Supplementary Tab. 2). Consistent with typical coverage scaling approaches, the bin coverage is scaled relative to an autosomal baseline. This normalizes for the average gene count in autosomes, and the resulting ERBB2/autosomal-average ratio compensates for the presence of multiple copies of chromosomes. In contrast, ISH-based ERBB2 assays typically use CEP17 as the reference point.
Analytical validation
Breast cancer imaging algorithm
To validate BRIA’s ability to identify CTC candidates, its cell-level performance was evaluated on an analytical validation dataset that consisted of manually confirmed CTC candidates, non-CTCs, and visual artifacts from patients’ samples. The cell-level performance of the HER2 IF protein analysis (Supplementary Fig. 1) was assessed using a high-marker-expressing cell line (MDA-MB-453) and a low-marker-expressing cell line (MDA-MB-231). Also, several breast cancer cell lines spiked into healthy donors’ blood were tested for their HER2 median cellular fluorescence intensity (MFI) values on Epic’s assay (Supplementary Fig. 2).
Copy number variation pipeline for ERBB2 and large-scale state transition detection
The accuracy for ERBB2 amplification detection was assessed using MDA-MB-453 cells as positives and WBCs as negatives; sensitivity and specificity were computed. The precision for ERBB2 amplification detection was assessed across two manufacturing lots of the sequencing-reagent kits, two operators, and two sequencing runs. To assess how the results were impacted by the additional variables, positive percent agreement (PPA) and negative percent agreement (NPA) were computed by comparing the mode across all replicates to each replicate result (Tab. 1).
Clinical concordance
Patients were included in the concordance study with distant metastases and with HER2 status as determined in a matched metastatic tissue biopsy using the standard, IHC, and/or ISH performed at each cancer center site and were tested by Epic’s CTC ER assay. The concordance of ERBB2 amplification was detected by single-cell CTC genomics. Contemporaneous is defined as patients with blood collection performed within about 30 days before tissue biopsy. By computing typical concordance metrics (PPA, NPA, positive predictive value [PPV], and negative predictive value [NPV]), we inferred the probability that the assay will provide a correct diagnosis of HER2 status as determined in a matched metastatic tissue biopsy. The two-sided 95% confidence interval for PPA and NPA was calculated using the Wilson score method and the Bayesian Rule formula (36,37).
| Biomarker | LOD
(n = 138) |
AV cutoff | Accuracy
(n = 162) |
Precision
(n = 162) |
|||
|---|---|---|---|---|---|---|---|
| Sensitivity | Specificity | PPA | NPA | ||||
| ERBB2 amplification | 2-fold
amplification |
>1.77
(ERBB2 Z-score) |
0.85 | 0.94 | 0.85 | 0.94 | |
The sensitivity and specificity of ERBB2 amplification detection were computed using WBCs and MDA-MB-453 cells as expected negatives and positives, respectively. Based on the expected statuses, true positives and true negatives, and false positives and false negatives were counted for all samples that passed QC.
AV = analytical validation; LOD = limit of detection; NPA = negative percentage agreement; PPA = positive percentage agreement; WBC = white blood cell.
Results
Analytical validation
BRIA and immunofluorescence
BRIA was built to reliably identify CTC candidates from patient slides with minimal manual review. It is based on earlier versions of Epic’s proprietary digital pathology used in its CTC assays (AR-V7 and others) (24-33,35,38). BRIA classifies cell candidates captured from slide images into two classes, “CTC” and “non-CTC,” using a predictive model. In the analytical validation analysis, the evaluation of the BRIA predictive model relies on “true positive,” which refers to a manually confirmed CTC that BRIA classified as “CTC,” and “true negative” refers to a non-CTC that BRIA classified as “non-CTC.” These labels are used in the calculation of BRIA’s cell-level performance metrics. At the cell level, BRIA had 99% sensitivity, 96% specificity, and 97% overall percentage agreement (OPA) for the validation dataset (Supplementary Tab. 1). The analytical performance at the cell level of the IF HER2 protein analysis was evaluated between the high-marker-expressing cell line (MDA-MB-453) and the low-marker-expressing cell line (MDA-MB-231) (Supplementary Fig. 1), and revealed a sensitivity, specificity, and accuracy of 94%, 97%, and 95%, respectively (Supplementary Fig. 1). To demonstrate the assay’s ability to cover the dynamic range of intensity levels of HER2, Epic spiked cells from several breast cancer cell lines into tubes of healthy donor blood and tested the spiked blood on Epic’s CTC ERBB2 assay. The resulting single-cell data showed that the overall HER2 intensity levels were consistent with expectations for well-characterized cell lines based on reported IHC values (39,40) (Supplementary Fig. 2).
Single-cell genomic assay
To validate the single-cell genomic pipeline’s ability to identify ERBB2 copy number amplification and chromosomal instability, we analyzed WBCs from healthy donors and well-characterized breast cancer cell lines (SK-BR-3, MDA-MB-453, and MCF-7) with known chromosomal instability and known ERBB2 amplification status as negative and positive controls, respectively. The experiments, cell types, and the number of cells used for analytical validation are summarized in Supplementary Tab. 2. To evaluate the limit of detection (LOD) for the detection of chromosomal instability, a copy number variation simulator was used to introduce different amounts of large copy number changes (which would result in large-scale state transitions [LSTs]) to the WBC base genomes (Supplementary Fig. 3). Modified genomes with at least 10 breakpoints were consistently called as chromosomally unstable (sensitivity of 91%), which was considered the LOD for chromosomal instability detection (Fig. 3). ERBB2 amplification was not detected in WBCs and MCF-7 cells but was detected in MDA-MB-453 and SK-BR-3 cells (Tab. 1 and Fig. 3). Given that MDA-MB-453 cells had an expected 2-fold ERBB2 amplification, that 2-fold level was considered the LOD for detection of ERBB2 amplification. The sensitivity and specificity for detecting the 2-fold ERBB2 amplification were 85% and 94%, respectively (Tab. 1). Precision was assessed across two sequencing runs, two lots, and two operators and the overall PPA and NPA were 85% and 94%, respectively (Tab. 1).
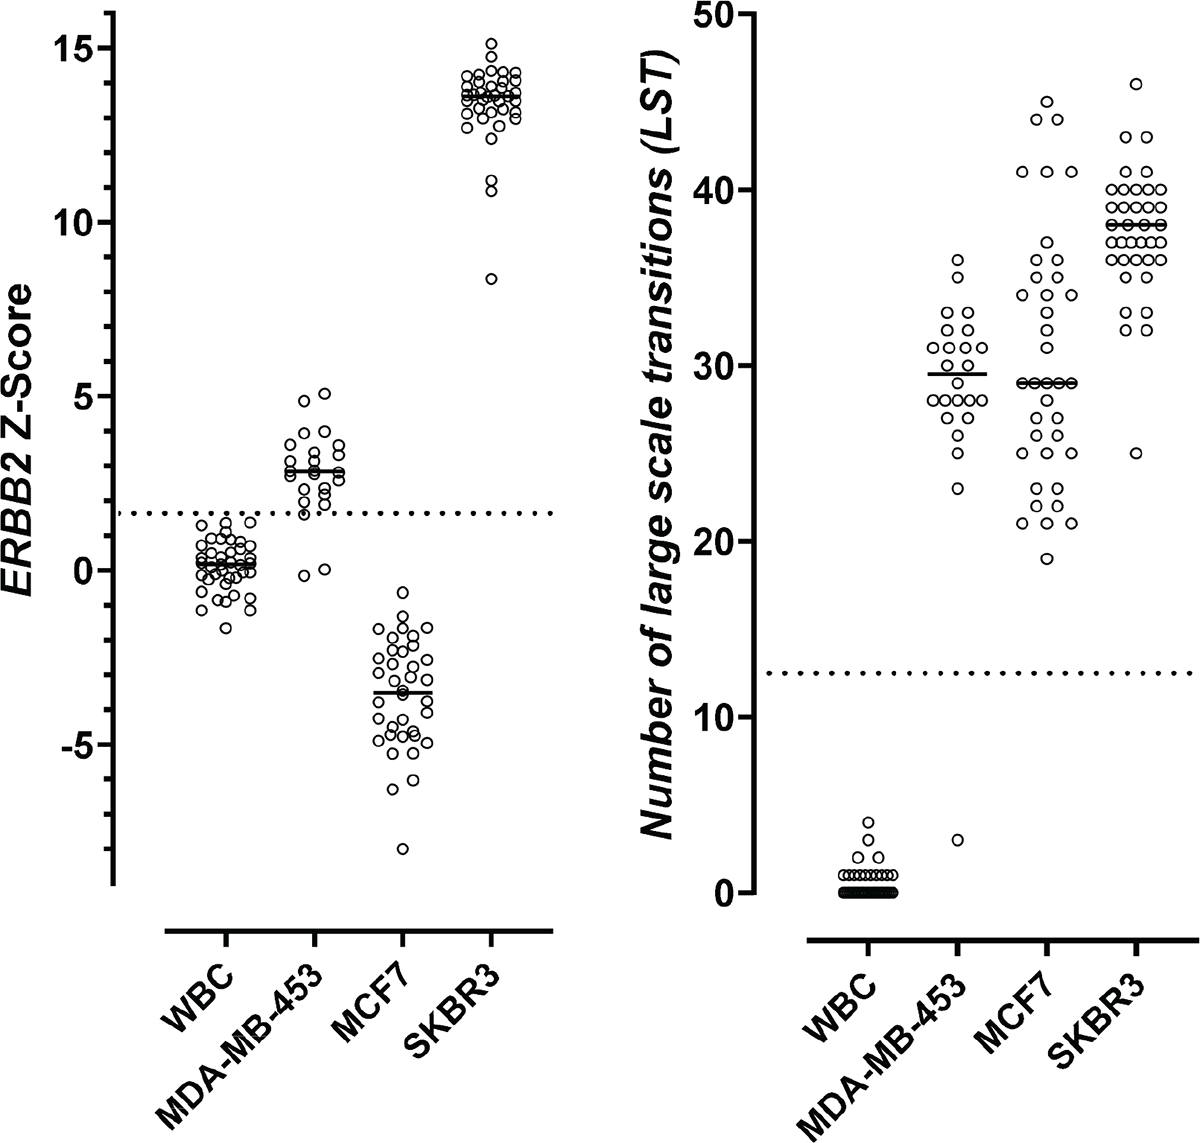
FIGURE 4 - Distributions of ERBB2 Z-scores and numbers of LSTs in WBCs and cells from characterized breast cancer cell lines. WBCs are negative controls with expected chromosomal stability (right) and ERBB2 non-amplified (left). Breast cancer cell lines MDA-MB-453 and SKBR3 are positive controls with expected chromosomal instability (right) and ERBB2 amplification (left). Breast cancer cell line MCF7 has expected chromosomal instability (right) and no ERBB2 amplification (left). The dotted line on the left represents the ERBB2 Z-score cutoff (1.77) that was used in analytical validation for defining ERBB2 amplification positivity. The dotted line on the right highlights the LST cutoff (12). LST, large-scale state transitions; WBC = white blood cell.
Clinical concordance
Patients with tissue biopsy results who were diagnosed with MBC with distant metastases were tested by Epic’s CTC ERBB2 (HER2) assay (n = 128; Supplementary Fig. 4). Fifty percent (64/128) of patients tested in the clinical concordance cohort were found to be reported as either ERBB2 positive or ERBB2 negative by CTC ERBB2 (HER2) assay, based on the scoring system described in Figure 4 and were included in the Clinical Concordance set (n = 64) analysis, 50% were considered inconclusive due to lack of chromosomal instability or by quality control parameters and were excluded from analysis (Supplementary Fig. 4). The Clinical Concordance set reported here (n = 64) and the clinical and histopathological features at diagnosis of the Clinical Concordance set are shown in Table 2. In Supplementary Figure 5, we show the distributions of the maximum ERBB2 Z-score among LST+CTC per patient with ERBB2 amp status (mean: Z-score 7.5) and ERBB2 non-amp (mean: Z-score 0.65) status. To test the correlation between the ERBB2 CTC assay results and stage of metastatic disease Supplementary Figure 6 shows the distributions of the maximum ERBB2 Z-score among LST+CTC per patient across those who received first-line (1L) (mean: Z score 2.7) or second-line and higher (>1L+) therapy (mean: Z-score 3.7) for metastatic disease after the blood was drawn for CTC analysis and found no significant differences. Similarly, as shown in Supplementary Figure 7, we found no significant difference between the distribution of the number of LST+CTC in patients who received first-line (1L) (mean: 5.0 LST+ CTC) or second-line and higher (>1L+) therapy (mean: 4.8 LST+ CTC) for metastatic disease after the blood was drawn for CTC analysis. Epic’s CTC ERBB2 (HER2) assay scoring system was applied to the Clinical Concordance set; the concordance analysis showed a sensitivity of 69% and specificity of 78% to the comparator results of the tissue biopsies (Tab. 3). Based on the rationale that HER2 status determination on bone biopsy samples has reported decreased sensitivity of ISH analysis of ERBB2 gene amplification (17,41), a subgroup analysis of only patients with non-bone tissue biopsies was performed (Supplementary Fig. 4) and, as expected, it showed that concordance was improved, with sensitivity of 86% and specificity of 75% (Tab. 3). Based on the rationale that HER2 status can change during the course of treatment and progression, a second subgroup analysis was performed to include only patients with contemporaneous tissue biopsies (Supplementary Fig. 4). When including only patients with HER2 status assessed by tissue biopsies that were both contemporaneous (to the comparator blood draw) and were performed on non-bone tissue (Supplementary Fig. 4), the concordance to tissue biopsy improved to a sensitivity of 100% and a specificity of 75% (Tab. 3). These results provide evidence of the contribution of time as a source of discordance between the results of Epic’s CTC ERBB2 (HER2) assay and the tissue biopsy comparators.
| Clinical and histopathological features | % of patients with MBC (number/total) | |
|---|---|---|
| Line of treatment | ||
|
1. First line |
83% (53/64) | |
|
2. Second line or above |
14% (9/64) | |
|
3. Unknown |
3% (2/64) | |
| Tissue biopsies | ||
1. Contemporaneous |
89% (57/64) | |
|
2. Non-contemporaneous |
11% (7/64) | |
|
3. IHC performed |
97% (62/64) | |
|
4. ISH performed |
37% (24/64) | |
|
5. Tissue site |
||
|
a) Bone |
39% (25/64) | |
|
b) Non-bone |
61% (39/64) | |
|
c) Liver |
28% (18/64) | |
|
d) Breast |
16% (10/64) | |
|
e) Lymph node |
11% (7/64) | |
|
f) Lung |
2% (1/64) | |
|
g) Omentum |
2% (1/64) | |
|
h) Pleural fluid |
2% (1/64) | |
|
i) Stomach |
2% (1/64) | |
|
6. Non-bone |
61% (39/64) | |
|
7. HER2+ |
20% (13/64) | |
|
a) HER2+ by IHC |
11% (7/62) | |
|
b) HER2+ by ISH |
25% (6/24) | |
|
8. ER+ |
78% (50/64) |
ER = estrogen receptor; IHC = immunohistochemistry; ISH = in situ hybridization; MBC = metastatic breast cancer.
Discussion
This report shows the analytical and clinical performance of Epic’s CTC ERBB2 (HER2) cell-based liquid biopsy assay’s ability to detect ERBB2 amplifications in MBC patients. The assay is a test intended for a population with very limited options available to get individualized sequential information about the treatment that is most likely to be efficacious.
A substantial improvement in the CTC ERBB2 (HER2) assay’s characterization of CTCs over conventional liquid biopsy assays is that, as a criteria of CTC classification and enumeration, it takes advantage of a characteristic genomic feature of tumor cells, which is the presence of chromosomal instability, a biological mechanism of tumor evolution and adaptation to environmental pressures that enables tumor progression and metastatic capabilities (42-44). Peer-reviewed data showed that genomic sequencing applied to CTCs from Epic Sciences’ assay allowed identification of high chromosomal instability within CTCs (35,42,45) that was independently associated with worse survival in men with high-risk metastatic castration-resistant prostate cancer treated with abiraterone/enzalutamide that may benefit alternative treatments (42). In this report, concordance of ERBB2 status was analyzed only in the subgroup of patients with CTCs with high LSTs by the CTC ERBB2 (HER2) assay, which indicates the detection of chromosomal instability. Only 50% of patients were found to have CTCs with high numbers of chromosomal instability. Clinical studies will be performed to test whether patients with detection of chromosomally unstable CTCs reported here will associate with patient’s outcome.
| Sample | N | PPA | NPA | PPV | NPV | Comments |
|---|---|---|---|---|---|---|
| Clinical Concordance set | 64 | 0.69 | 0.78 | 0.45 | 0.91 | Overall population |
| Subgroup analysis limited to patients with non-bone biopsies | 39 | 0.86 | 0.75 | 0.46 | 0.96 | Removal of patients with bone biopsies improves sensitivity |
| Subgroup analysis limited to patients with only contemporaneous non-bone biopsies | 35 | 1.00 | 0.75 | 0.50 | 1.00 | Removal of patients with non-contemporaneous tissue biopsy and bone biopsies further improves sensitivity in the Clinical Concordance set |
Concordance of Clinical Concordance set patients (and subgroups of patients with non-bone and contemporaneous tissue samples) with results from tissue biopsy. When including only patients with HER2 status assessed by tissue biopsies that were both contemporaneous and from non-bone tissue, the concordance to tissue biopsies improved to a sensitivity of 100% and a specificity of 75%.
NPA = negative percent agreement; NPV = negative predictive value; PPA = positive percent agreement; PPV = positive predictive value.
Typically, reliable tumor identification in histopathological tissue biopsy analysis of HER2 status does not require genomic assessment but instead requires a pathologist to visually examine patterns of cell shapes and regions of tissue structure to identify cancer cells by morphological assessment and to perform proper semiquantitative scoring of HER2 expression on those cancer cells. However, liquid biopsy assays are limited to the analysis of those few rare CTCs (or ctDNA) in the sample that are in suspension, without their tissue contexture, and sometimes may be morphologically indistinguishable from circulating nontumor cells by the trained pathologist (or from DNA shed from endogenous germ-line cells, called cell-free DNA [cfDNA]). To avoid this problem, detection of chromosomal instability in CTCs, a common feature of metastatic cancer cells (42,43), increases the probability that the CTCs on which ERBB2 is evaluated represent truly neoplastic components of the tumor, thus making the ERBB2 CTC assay diagnostic assessments tumor specific. Therefore, as compared to analysis based on cfDNA, Epic’s assay can detect ERBB2 amplifications with high sensitivity because it is evaluating a pool of DNA that comes entirely from a tumor cell with chromosomal instability, as detected by high numbers of LSTs. Development efforts are ongoing to test whether artificial intelligence algorithms trained on thousands of chromosomally unstable CTCs will be capable of differentiating subsets of cancer cells by using only morphological patterns.
Potential confounding factors impacting our concordance analysis are the following: First, there are no available orthogonal assays to demonstrate concordance in the same blood sample. As an alternative, we measured concordance comparing the blood assay results to metastatic tumor tissue biopsies rather than comparing the same blood sample analyzed with different CTC-based assays. Second, bone tissues often represent the location of first distant metastasis in patients (46) but bone biopsies utilizing older decalcification techniques could be falsely negative for HER2 overexpression or ERBB2 amplification (17,41). In fact, bone biopsies from bone-only metastatic patients are often excluded from clinical trials of HER2 expression as exemplified by the recently published DAISY trial (47). Additional factors contribute to assay variability, such as lack of central laboratory verification for pathological tissue biopsy results. These may reflect variations in pathologists’ assessment of HER2 status in tissue biopsies that do not control and are not accounted for within reported analytical variation. Validation studies using a contemporaneous dataset of tissue biopsy samples analyzed in central pathology labs will be needed to confirm these correlative findings in a larger dataset. Clinical utility studies have been designed to test whether the CTC ERBB2 assay will inform improved treatment decision-making to HER2-targeted therapies over the current standard of care for MBC patients.
Acknowledgments
Research support for this study was funded by Epic Sciences. The data are available within the article and the Supplementary Information provided with this article. For additional data that may be under restricted access in compliance with patient consent and ethical principles for data sharing request, please contact the corresponding author.
Disclosures
Conflict of interest: E.T.L., E.W., D.Z., D.B., M.B., N.D., M.S., and R.W. are or have been employed by Epic Sciences. L.S. has received honoraria for consulting from Epic Sciences.
Funding: The research and the work presented were funded by Epic Sciences.
Author contributions: G.D.C. designed the clinical study, performed the statistical analysis, and drafted the manuscript. E.T.L., E.W., and D.Z. designed and developed the genomic platform and performed statistical analysis. D.B. and M.B. designed and developed the immunofluorescent platform. N.D. is a board-certified clinical pathologist who reviewed the CTC candidates and interpreted the clinical results. M.S. coordinated clinical study samples’ accrual, clinical data collection, and data entry. L.S. and R.W. provided scientific guidance, revised the manuscript draft with all authors contributing and providing feedback and advice.
References
- 1. Carey LA, Perou CM, Livasy CA, et al. Race, breast cancer subtypes, and survival in the Carolina breast cancer study. JAMA. 2006;295(21):2492-2502. CrossRef
- 2. Martínez-Sáez O, Prat A. Current and future management of HER2-positive metastatic breast cancer. JCO Oncol Pract. 2021;17(10):594-604. CrossRef
- 3. Wolff AC, Hammond MEH, Hicks DG, et al; American Society of Clinical Oncology; College of American Pathologists. Recommendations for human epidermal growth factor receptor 2 testing in breast cancer: American Society of Clinical Oncology/College of American Pathologists clinical practice guideline update. J Clin Oncol. 2013;31(31):3997-4013. CrossRef PubMed
- 4. Gradishar WJ, Moran MS, Abraham J, et al. Breast Cancer, Version 3.2022, NCCN Clinical Practice Guidelines in Oncology. J Natl Compr Canc Netw. 2022;20(6):691-722. CrossRef PubMed
- 5. Gilson P, Merlin JL, Harlé A. Deciphering tumour heterogeneity: from tissue to liquid biopsy. Cancers (Basel). 2022;14(6):1384. CrossRef PubMed
- 6. Hiley C, de Bruin EC, McGranahan N, Swanton C. Deciphering intratumor heterogeneity and temporal acquisition of driver events to refine precision medicine. Genome Biol. 2014 Aug 27;15(8):453. CrossRef PubMed
- 7. Zardavas D, Irrthum A, Swanton C, Piccart M. Clinical management of breast cancer heterogeneity. Nat Rev Clin Oncol. 2015;12(7):381-394. CrossRef PubMed
- 8. Pasha N, Turner NC. Understanding and overcoming tumor heterogeneity in metastatic breast cancer treatment. Nat Cancer. 2021;2(7):680-692. CrossRef PubMed
- 9. Hapach LA, Carey SP, Schwager SC, et al. Phenotypic heterogeneity and metastasis of breast cancer cells. Cancer Res. 2021;81(13):3649-3663. CrossRef PubMed
- 10. Lee JK, Choi YL, Kwon M, Park PJ. Mechanisms and consequences of cancer genome instability: lessons from genome sequencing studies. Annu Rev Pathol. 2016;11(1):283-312. CrossRef PubMed
- 11. Tellez-Gabriel M, Ory B, Lamoureux F, Heymann MF, Heymann D. Tumour heterogeneity: the key advantages of single-cell analysis. Int J Mol Sci. 2016;17(12):2142. CrossRef PubMed
- 12. McGranahan N, Swanton C. Clonal heterogeneity and tumor evolution: past, present, and the future. Cell. 2017;168(4):613-628. CrossRef PubMed
- 13. Kaufman PA, Bloom KJ, Burris H, et al. Assessing the discordance rate between local and central HER2 testing in women with locally determined HER2-negative breast cancer. Cancer. 2014 Sep 1;120(17):2657-2664CrossRef. Epub 2014 Jun 13. PubMed
- 14. Paik S, Bryant J, Tan-Chiu E, et al. Real-world performance of HER2 testing – National Surgical Adjuvant Breast and Bowel Project experience. J Natl Cancer Inst. 2002 Jun 5;94(11):852-854. CrossRef. PubMed
- 15. Schrijver WAME, Suijkerbuijk KPM, van Gils CH, van der Wall E, Moelans CB, van Diest PJ. Receptor conversion in distant breast cancer metastases: a systematic review and meta-analysis. J Natl Cancer Inst. 2018 Jun 1;110(6):568-580. CrossRef. PubMed
- 16. Aktas B, Kasimir-Bauer S, Müller V, et al; DETECT Study Group. Comparison of the HER2, estrogen and progesterone receptor expression profile of primary tumor, metastases and circulating tumor cells in metastatic breast cancer patients. BMC Cancer. 2016;16(1):522. CrossRef PubMed
- 17. Schrijver WAME, van der Groep P, Hoefnagel LD, et al. Influence of decalcification procedures on immunohistochemistry and molecular pathology in breast cancer. Mod Pathol. 2016;29(12):1460-1470. CrossRef PubMed
- 18. Van Poznak C, Somerfield MR, Bast RC, et al. Use of biomarkers to guide decisions on systemic therapy for women with metastatic breast cancer: American Society of Clinical Oncology clinical practice guideline. J Clin Oncol. 2015;33(24):2695-2704. CrossRef PubMed
- 19. Micalizzi DS, Maheswaran S, Haber DA. A conduit to metastasis: circulating tumor cell biology. Genes Dev. 2017 Sep 15;31(18):1827-1840. CrossRef. PubMed
- 20. Alix-Panabières C, Pantel K. Liquid biopsy: from discovery to clinical application. Cancer Discov. 2021;11(4):858-873. CrossRef PubMed
- 21. Alix-Panabières C, Pantel K. Liquid biopsy: from discovery to clinical application. Cancer Discov. 2021 Apr;11(4):858-873. CrossRef. PubMed
- 22. Joosse SA, Gorges TM, Pantel K. Biology, detection, and clinical implications of circulating tumor cells. EMBO Mol Med. 2015;7(1):1-11. CrossRef PubMed
- 23. Keomanee-Dizon K, Shishido SN, Kuhn P. Circulating tumor cells: high-throughput imaging of CTCs and bioinformatic analysis. In: Recent results in cancer research. Vol 215. Springer: New York LLC; 2020:89-104. CrossRef
- 24. Werner SL, Graf RP, Landers M, et al. Analytical validation and capabilities of the epic CTC platform: enrichment-free circulating tumour cell detection and characterization. J Circ Biomark. 2015;4:3. CrossRef PubMed
- 25. Scher HI, Lu D, Schreiber NA, et al. Association of AR-V7 on circulating tumor cells as a treatment-specific biomarker with outcomes and survival in castration-resistant prostate cancer. JAMA Oncol. 2016;2(11):1441-1449. CrossRef PubMed
- 26. Armstrong AJ, Luo J, Nanus DM, et al. Prospective multicenter study of circulating tumor cell AR-V7 and taxane versus hormonal treatment outcomes in metastatic castration-resistant prostate cancer. JCO Precis Oncol. 2020;4(4):1285-1301. CrossRef PubMed
- 27. Graf RP, Hullings M, Barnett ES, Carbone E, Dittamore R, Scher HI. Clinical utility of the nuclear-localized AR-V7 biomarker in circulating tumor cells in improving physician treatment choice in castration-resistant prostate cancer. Eur Urol. 2020;77(2):170-177. CrossRef PubMed
- 28. Lu D, Krupa R, Harvey M, et al. Development of an immunofluorescent AR-V7 circulating tumor cell assay – a blood-based test for men with metastatic prostate cancer. J Circ Biomark. 2020;9(1):13-19. CrossRef PubMed
- 29. Scher HI, Graf RP, Schreiber NA, et al. Nuclear-specific AR-V7 protein localization is necessary to guide treatment selection in metastatic castration-resistant prostate cancer. Eur Urol. 2017;71(6):874-882. CrossRef PubMed
- 30. Scher HI, Graf RP, Schreiber NA, et al. Phenotypic heterogeneity of circulating tumor cells informs clinical decisions between AR signaling inhibitors and taxanes in metastatic prostate cancer. Cancer Res. 2017;77(20):5687-5698. CrossRef PubMed
- 31. Beltran H, Jendrisak A, Landers M, et al. The initial detection and partial characterization of circulating tumor cells in neuroendocrine prostate cancer. Clin Cancer Res. 2016;22(6):1510-1519. CrossRef PubMed
- 32. Bjartell AS. Re: The initial detection and partial characterization of circulating tumor cells in neuroendocrine prostate cancer. Eur Urol. 2016;70(4):700. CrossRef PubMed
- 33. Fujii T, Reuben JM, Huo L, et al. Androgen receptor expression on circulating tumor cells in metastatic breast cancer. PLoS One. 2017;12(9):e0185231. CrossRef PubMed
- 34. Dago AE, Stepansky A, Carlsson A, et al. Rapid phenotypic and genomic change in response to therapeutic pressure in prostate cancer inferred by high content analysis of single circulating tumor cells. PLoS One. 2014;9(8):e101777. CrossRef PubMed
- 35. Greene SB, Dago AE, Leitz LJ, et al. Chromosomal instability estimation based on next generation sequencing and single cell genome wide copy number variation analysis. PLoS One. 2016;11(11):e0165089. CrossRef PubMed
- 36. Efron B. Mathematics. Bayes’ theorem in the 21st century. Science. 2013 Jun 7;340(6137):1177-1178. CrossRef PubMed
- 37. Bours MJ. Bayes’ rule in diagnosis. J Clin Epidemiol. 2021;131:158-160. CrossRef PubMed
- 38. Zhang L, Beasley S, Prigozhina NL, et al. Detection and characterization of circulating tumour cells in multiple myeloma. J Circ Biomark. 2016;5:10. CrossRef PubMed
- 39. Subik K, Lee JF, Baxter L, et al. The expression patterns of ER, PR, HER2, CK5/6, EGFR, Ki-67 and AR by immunohistochemical analysis in breast cancer cell lines. Breast Cancer (Auckl). 2010 May 20;4:35-41. Erratum in: Breast Cancer (Auckl). 2018 Oct 16;12:1178223418806626. PubMed
- 40. McCabe A, Dolled-Filhart M, Camp RL, Rimm DL. Automated quantitative analysis (AQUA) of in situ protein expression, antibody concentration, and prognosis. J Natl Cancer Inst. 2005;97(24):1808-1815. CrossRef PubMed
- 41. Gertych A, Mohan S, Maclary S, et al. Effects of tissue decalcification on the quantification of breast cancer biomarkers by digital image analysis. Diagn Pathol. 2014;9(1):213. CrossRef PubMed
- 42. Brown LC, Halabi S, Schonhoft JD, et al. Circulating tumor cell chromosomal instability and neuroendocrine phenotype by immunomorphology and poor outcomes in men with mCRPC treated with abiraterone or enzalutamide. Clin Cancer Res. 2021;27(14):4077-4088. CrossRef PubMed
- 43. Manié E, Popova T, Battistella A, et al. Genomic hallmarks of homologous recombination deficiency in invasive breast carcinomas. Int J Cancer. 2016;138(4):891-900. CrossRef PubMed
- 44. Sansregret L, Swanton C. The role of aneuploidy in cancer evolution. Cold Spring Harb Perspect Med. 2017;7(1):a028373. CrossRef PubMed
- 45. Malihi PD, Graf RP, Rodriguez A, et al. Single-cell circulating tumor cell analysis reveals genomic instability as a distinctive feature of aggressive prostate cancer. Clin Cancer Res. 2020;26(15):4143-4153. CrossRef PubMed
- 46. Parkes A, Clifton K, Al-Awadhi A, et al. Characterization of bone only metastasis patients with respect to tumor subtypes. NPJ Breast Cancer. 2018;4(1):2. CrossRef PubMed
- 47. Mosele F, Deluche E, Lusque A, et al. Trastuzumab deruxtecan in metastatic breast cancer with variable HER2 expression: the phase 2 DAISY trial. Nat Med. 2023;29(8):2110-2120. CrossRef PubMed