|
J Circ Biomark 2023; 12: 26-33 ISSN 1849-4544 | DOI: 10.33393/jcb.2023.2629 ORIGINAL RESEARCH ARTICLE |
Analytical performance of the FDA-cleared Parsortix® PC1 system
ABSTRACT
Introduction: The Parsortix® PC1 system, Food and Drug Administration (FDA) cleared for use in metastatic breast cancer (MBC) patients, is an epitope-independent microfluidic device for the capture and harvest of circulating tumor cells from whole blood based on cell size and deformability. This report details the analytical characterization of linearity, detection limit, precision, and reproducibility for this device.
Methods: System performance was determined using K2-EDTA blood samples collected from self-declared healthy female volunteers (HVs) and MBC patients spiked with prelabeled cultured breast cancer cell lines (SKBR3, MCF7, or Hs578T). Samples were processed on Parsortix® PC1 systems and captured cells were harvested and enumerated.
Results: The system captured and harvested live SKBR3, MCF7, and Hs578T cells and fixed SKBR3 cells linearly between 2 and ~100 cells, with average harvest rates of 69%, 73%, 79%, and 90%, respectively. To harvest ≥1 cell ≥95% of the time, the system required 3, 5 or 4 live SKBR3, MCF7 or Hs578T cells, respectively. Average harvest rates from precision studies using 5, 10, and ~50 live cells spiked into blood for each cell line ranged from 63.5% to 76.2%, with repeatability and reproducibility percent coefficient of variation (%CV) estimates ranging from 12.3% to 32.4% and 13.3% to 34.1%, respectively. Average harvest rates using ~20 fixed SKBR3 cells spiked into HV and MBC patient blood samples were 75.0% ± 16.1% (%CV = 22.3%) and 68.4% ± 14.3% (%CV = 21.1%), respectively.
Conclusions: These evaluations demonstrate the Parsortix® PC1 system linearly and reproducibly harvests tumor cells from blood over a range of 1 to ~100 cells.
Keywords: Blood, Breast cancer, Circulating tumor cells, Liquid biopsy, Microfluidic devices, Neoplastic cells
Received: July 4, 2023
Accepted: July 20, 2023
Published online: August 7, 2023
Journal of Circulating Biomarkers - ISSN 1849-4544 - www.aboutscience.eu/jcb
© 2023 The Authors. This article is published by AboutScience and licensed under Creative Commons Attribution-NonCommercial 4.0 International (CC BY-NC 4.0).
Commercial use is not permitted and is subject to Publisher’s permissions. Full information is available at www.aboutscience.eu
Introduction
There is increasing interest in using liquid biopsy in the clinical setting as a tool for personalized medicine through the detection and characterization of cells that could seed metastasis, for longitudinal monitoring of cancer patients in real time, identifying treatment regimens or response and/or minimal residual disease (MRD). A liquid biopsy is ideal for these purposes due to the minimally invasive and repeatable nature of a blood draw, in contrast to traditional tissue biopsies (1,2,3).
Circulating tumor cells (CTCs) are cancer cells that have intravasated into the bloodstream or lymphatic system from primary and/or metastatic tumors (4,5). CTCs released from primary tumors into the bloodstream can travel to distant sites and form secondary tumors, an integral part of the metastatic process. Epithelial-mesenchymal transition (EMT) is a crucial process enabling CTC detachment, intravasation into the circulation, extravasation from the circulation, and, ultimately, metastases formation (1,5,6,7). Cancer cells circulate both as single CTCs and CTC clusters, with CTC clusters showing an increased metastatic potential (5,8). Isolating and characterizing the cells that have the potential to metastasize (i.e., CTCs) is vitally important, considering that ~90% of cancer deaths are due to metastasis (9).
Isolation and interrogation of CTCs has been challenging due to the rarity of these cells in the bloodstream, with approximately one cell in 105–106 peripheral blood mononuclear cells (PBMCs) (4,5,10). Yet it has been documented that the detection of CTCs is a clinically relevant predictor of disease progression and overall survival in patients with metastatic breast cancer (MBC) (11,12,13,14,15,16). A recent study using the Parsortix® system to obtain CTCs from blood reported a high concordance in predictive biomarker expression between the CTCs and tissue from the metastases, demonstrating that analysis of CTCs may serve as a surrogate sample for evaluation of biomarkers for breast cancer metastases (17).
Many technologies have been developed for CTC isolation, including biological and physical-based methods (7,18,19). Biological-based methods isolate CTCs based on phenotype and rely on antibodies to select cells of interest. Many of these, including the CellSearch® System, isolate CTCs based on expression of the epithelial cell adhesion molecule (EpCAM), which is expressed by a subset of CTCs. CTCs released into the bloodstream are often either undergoing or have undergone EMT, which involves upregulation of mesenchymal gene expression and downregulation of epithelial gene expression (20). This results in failure of EpCAM-based methods to efficiently isolate mesenchymal and/or EMTing CTCs, the CTC phenotype that may be more representative of cells capable of forming distant metastases (19). In addition, the use of antibodies for capture could impact downstream analysis (18,21) of the captured CTCs. These limitations identify a critical need for physical-based, or epitope-independent, CTC isolation methods enabling the capture and subsequent characterization of broader CTC populations.
The Parsortix® PC1 system is a semi-automated, epitope-independent microfluidic device that captures and subsequently harvests rare cells (including CTCs) from whole blood based on their size and deformability (22,23,24,25,26,27,28,29). This physical-based method of CTC isolation is not reliant on specific antigen expression for capture and enables enrichment of both epithelial and mesenchymal cells (22,24,25,29). The system also harvests the captured cells from the microfluidic device into a small volume of buffer (~210 µL) for subsequent user-defined evaluation.
The studies reported here were designed to evaluate the analytical performance of the Parsortix® PC1 system for the capture and harvest of breast cancer cells, including assessment of linearity, limit of detection (LoD), precision, and reproducibility, using whole blood samples spiked with live or fixed cultured breast cancer cell lines (SKBR3, MCF7, or Hs578T). The breast cancer cell lines chosen for spiking are representative of the heterogeneity observed in breast cancer and breast cancer CTCs (30,31,32,33). The analytical performance data generated herein plus the previously published clinical performance data (34) were included in the de novo request for the classification of the Parsortix® PC1 system (DEN200062) as a Class II medical device, which the Food and Drug Administration (FDA) granted in May 2022 (Online).
Methods
Blood sample collection
Blood was collected via venipuncture from self-declared healthy female volunteers (HVs) and via either a venipuncture or an existing port from MBC patients into 10 mL K2-ethylenediaminetetraacetic acid (EDTA) tubes (Becton Dickinson). A minimum of 7.5 mL of blood per tube, up to a maximum of 80 mL of blood per donation, was obtained from each HV. A minimum of 5 mL of blood per tube was obtained from each MBC patient. The HVs were self-declared healthy, nonpregnant women aged ≥18 years with no known current illness or other serious health condition. MBC patients were women with documented evidence of MBC (as determined by any means). All women (HVs and MBC patients) gave written informed consent prior to collection of the blood samples under protocols that were reviewed and approved by the London-Surrey Borders Research Ethics Committee or the University of Rochester Research Study Review Board.
Cell lines
The breast cancer cell lines SKBR3, MCF7, and Hs578T were obtained from the American Type Culture Collection (ATCC) and were chosen because they are representative of CTCs that would be found in the blood of patients with MBC based on their immunotype, phenotype, morphology, and size (Tab. I) (30,31,32,33,35,36,37,38). Cell line maintenance is detailed in the Supplementary Materials.
| SKBR3 | MCF7 | Hs578T | MBC patient-derived CTCs | |
|---|---|---|---|---|
| Breast cancer subtype | HER2 enriched | Luminal A | Basal/triple negative | All subtypes |
| Phenotype | Epithelial | Epithelial | Mesenchymal | Epithelial, EMT, and mesenchymal |
| Receptor status | ER/PR‐ and HER2+ | ER/PR+ and HER2- | ER/PR- and HER2- | ER/PR+/- and HER2-/+ |
| Morphology | Grape-like | Mass | Stellate | Highly polymorphic |
| Size | 15-17 µm (microscope and counter pipette) (Coumans et al (35)) | 16.5 µm (counter pipette) (Coumans et al (35)) | No data | 13.1 µm (Coumans et al (35))
11.79 (4.51-33.11) µm (Zhao et al (36)) 13.1 (12-25) µm (Hao et al (37)) 11 (6-16) µm2 (Coumans et al (38)) |
CTC = circulating tumor cell; EMT = epithelial-mesenchymal transition; MBC = metastatic breast cancer.
For each study, using the abovementioned cell lines, live or fixed cells (fixed using 4% formaldehyde [Sigma Aldrich]) were fluorescently labeled with CellTracker™ Green 5-chloromethylfluorescein diacetate (CMFDA; Life Technologies) as per the manufacturer’s instructions. The labeled cell lines were spiked into freshly collected blood samples as detailed below.
Blood sample preparation
For linearity, LoD, and live cell precision studies, spike levels of ≤100 cells were directly spiked, as a single droplet, onto the side of empty 12 mL polystyrene tubes. The number of cells in the droplet was counted by two independent operators using a Leica fluorescence microscope. When an accepted cell count within the droplet (see Tab. SI) was confirmed by two independent operators, 7.5 mL of blood was added to the tube, ensuring the blood flowed over the droplet containing the spiked cells. Spike levels of >100 cells were spiked directly into blood samples from cell dilutions prepared in phosphate-buffered saline (PBS) containing 1% bovine serum albumin (BSA; w/v) and 2 mM EDTA (BEP) (total volume of spike ≤5 µL). The numbers of cells spiked were calculated by spiking the same volume of cell dilution into six wells of a 96-well plate, each well containing 200 µL of 1× PBS (control plate), and either counting manually or using the Leica fluorescent microscope software and taking the mean of the six control spikes.
For precision and reproducibility studies using ~20 fixed, prelabeled SKBR3 cells, microfuge tubes containing known numbers of fixed, prelabeled SKBR3 cells (range between 17 and 25 cells) in ~180 µL of BEP were prepared (“Precision Tubes”). For spiking, the contents of a Precision Tube were pipetted into either 2.5 mL of PBS or a whole blood sample (study dependent), the tube was rinsed with 80 µL of additional PBS, and the 80 µL of additional PBS was pipetted into the PBS or whole blood sample.
ANGLE R&D Laboratory located in Guildford, UK, prepared and processed the samples unless stated otherwise.
Blood sample processing
All blood samples were processed within 8 hours of collection using Parsortix® PC1 systems and GEN3 6.5 µm cell separation cassettes at a constant pressure of 99 mbar (22). Captured cells were harvested from the cassettes directly into single wells on 96-well plates or onto polytetrafluoroethylene (“PTFE”) printed slides with 21 hydrophobic droplet spots for subsequent enumeration using a fluorescence microscope. The number of cells in each harvest was counted by a minimum of two independent operators.
Linearity evaluation
Linearity was determined for each cell line individually by preparing HV blood samples spiked with 2 to ~100 live or fixed (SKBR3 only), prelabeled cells (Tab. SI). Data were obtained from a minimum of 10 HVs per cell line and eight different spike levels, with each HV providing data for all spike levels. Additional blood samples were prepared by spiking ~125, ~250, ~500, and ~1000 live, prelabeled SKBR3 cells into 7.5 mL aliquots of blood. Data for the higher cell spike levels were obtained from a minimum of 10 HVs for each spike level, with each HV providing data for all spike levels. The linearity studies were designed in accordance with the Clinical and Laboratory Standards Institute (CLSI; formerly NCCLS) guideline EP06-A: Evaluation of Linearity of Quantitative Measurement Procedures: A Statistical Approach.
Limit of blank and LoD evaluation
Limit of blank (LoB) of the system was determined using unspiked HV blood samples. LoD was determined for each cell line individually by preparing HV blood samples directly spiked with 1, 2, 3, 4, or 5 live, prelabeled cells. Data were obtained from a minimum of 60 samples for each spike level and cell line, performed in accordance with the CLSI guideline EP17-A2: Evaluation of Detection Capability for Clinical Laboratory Measurement Procedures; Approved Guideline—Second Edition.
Precision evaluation
The precision studies were conducted in accordance with the CLSI guideline EP05-A3: Evaluation of Precision of Quantitative Measurement Procedures; Approved Guideline–Third Edition. Imprecision estimates for the Parsortix® PC1 system were evaluated for the different cell lines and spike levels using all three cell lines directly spiked into 7.5 mL aliquots of HV blood. For each cell line (SKBR3, MCF7, and Hs578T), 7.5 mL aliquots of blood from HVs were spiked with 5, 10, or ~50 live, prelabeled cells. For each spike level and cell line, data were obtained from a total of 100 samples, processed on 10 Parsortix® PC1 systems, two runs per system per day over a total of 5 nonconsecutive days. Additional precision studies evaluating fixed versus live cells, different cassette lots, and different laboratories were also conducted, and a description of these studies and their results can be found in the Supplementary Materials.
Reproducibility evaluation
A separate reproducibility study was conducted at the University of Rochester Medical Center (URMC). For this study, ≥5 mL of blood was collected from HVs and MBC patients into 10 mL K2-EDTA tubes. The blood tubes were spiked with ~20 fixed SKBR3 cells using Precision Tubes. Data were collected from a total of 150 spiked samples (76 HVs and 74 MBC patients) processed on four different Parsortix® PC1 systems.
Data analysis
A detailed description of the data analysis methods used for each study can be found in the Supplementary Materials.
Results
Linearity
The harvesting of live, prelabeled SKBR3, MCF7, and Hs578T and fixed SKBR3 cells by the Parsortix® PC1 system was demonstrated to be linear over the range of 2 to ~100 cells spiked into 7.5 mL of blood (Fig. 1A-D). Additionally, linearity of harvest was shown to extend to at least 1,000 live SKBR3 cells spiked into 7.5 mL of blood (Fig. 1E). The best fit model for all cell lines was the first-order linear regression model (the solid black line).
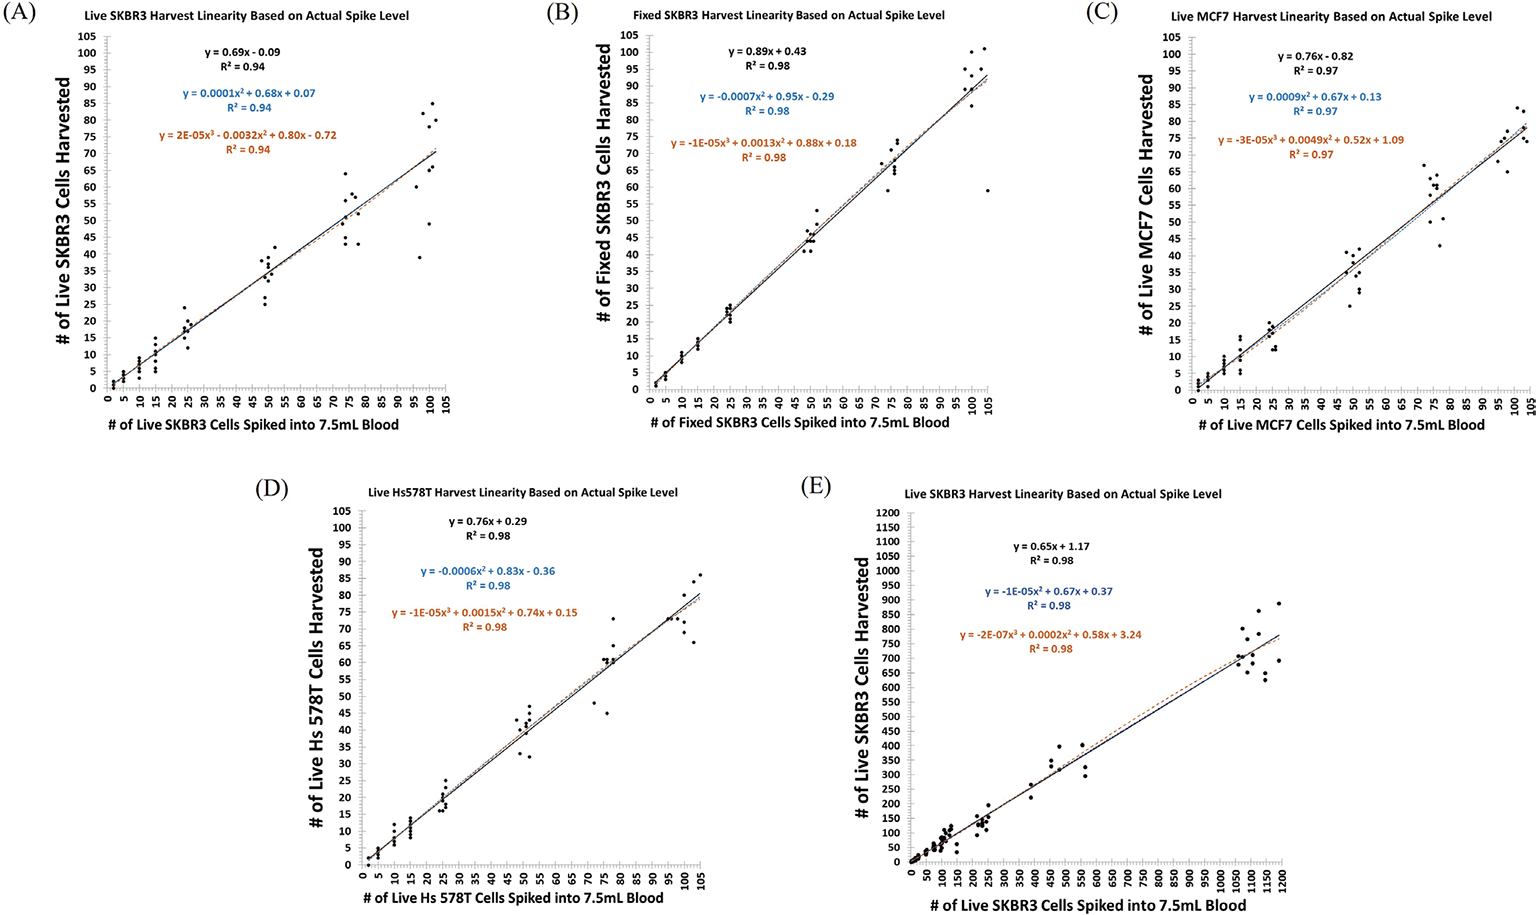
Over the range of 2 to ~100 live SKBR3 cells, the linear regression model had a slope of 0.69, indicating an average harvest rate of ~69% (95% confidence interval [CI] = 65%-73%, R2 = 0.94) (Fig. 1A) (34), whereas over the same range, fixed SKBR3 cells resulted in a slope of 0.89, indicating an average harvest rate of ~89% (95% CI = 85%-92%, R2 = 0.98) (Fig. 1B). The data show both an increased variability for the recovery of live SKBR3 cells and better recovery of the fixed SKBR3 cells. This was not unexpected due to the effects of fixation on cultured cells, resulting in reduced deformability of the fixed cells compared to live cells. Over the range of 2 to ~100 live MCF7 cells, the linear regression model had a slope of 0.76, indicating an average harvest rate of ~76% (95% CI = 73%-79%, R2 = 0.97) (Fig. 1C) (34) and over the same range, live Hs578T cells showed similar results with a slope of 0.76, indicating an average harvest rate of ~76% (95% CI = 74%-79%, R2 = 0.98) (Fig. 1D) (34). Average harvest rates for each cell spike level, along with the standard deviation (SD) and percent coefficient of variation (%CV) for each cell line can be found in Tables SII–SV.
Detection limit (LoB, LoD)
Using a total of 63 unspiked blood samples, the LoB of the Parsortix® PC1 system was determined to be zero cells, as expected. Only one (1.6%) of the 63 unspiked blood samples was found to have a single prelabeled cell harvested. Considering the results from a separate cell carryover study where no carryover of cells was observed after the spiking of >2,000 cultured cells, the observation of a single cell in an unspiked sample is likely the result of a user error (e.g., improper labeling of the sample as a control when it was actually a spiked sample).
The LoD was determined for each cell line separately using a type II error level (β = false negative rate) of <5%, which equated to the spike level at which ≥95% of the replicate samples for a given cell line had ≥1 cell observed in the harvests (Fig. 2). For the SKBR3 and Hs578T cell lines, spiking of 5 live cells into blood was not performed as the detection limit, as per the specified definition, had already been reached at a cell spike level of fewer than 5 cells.
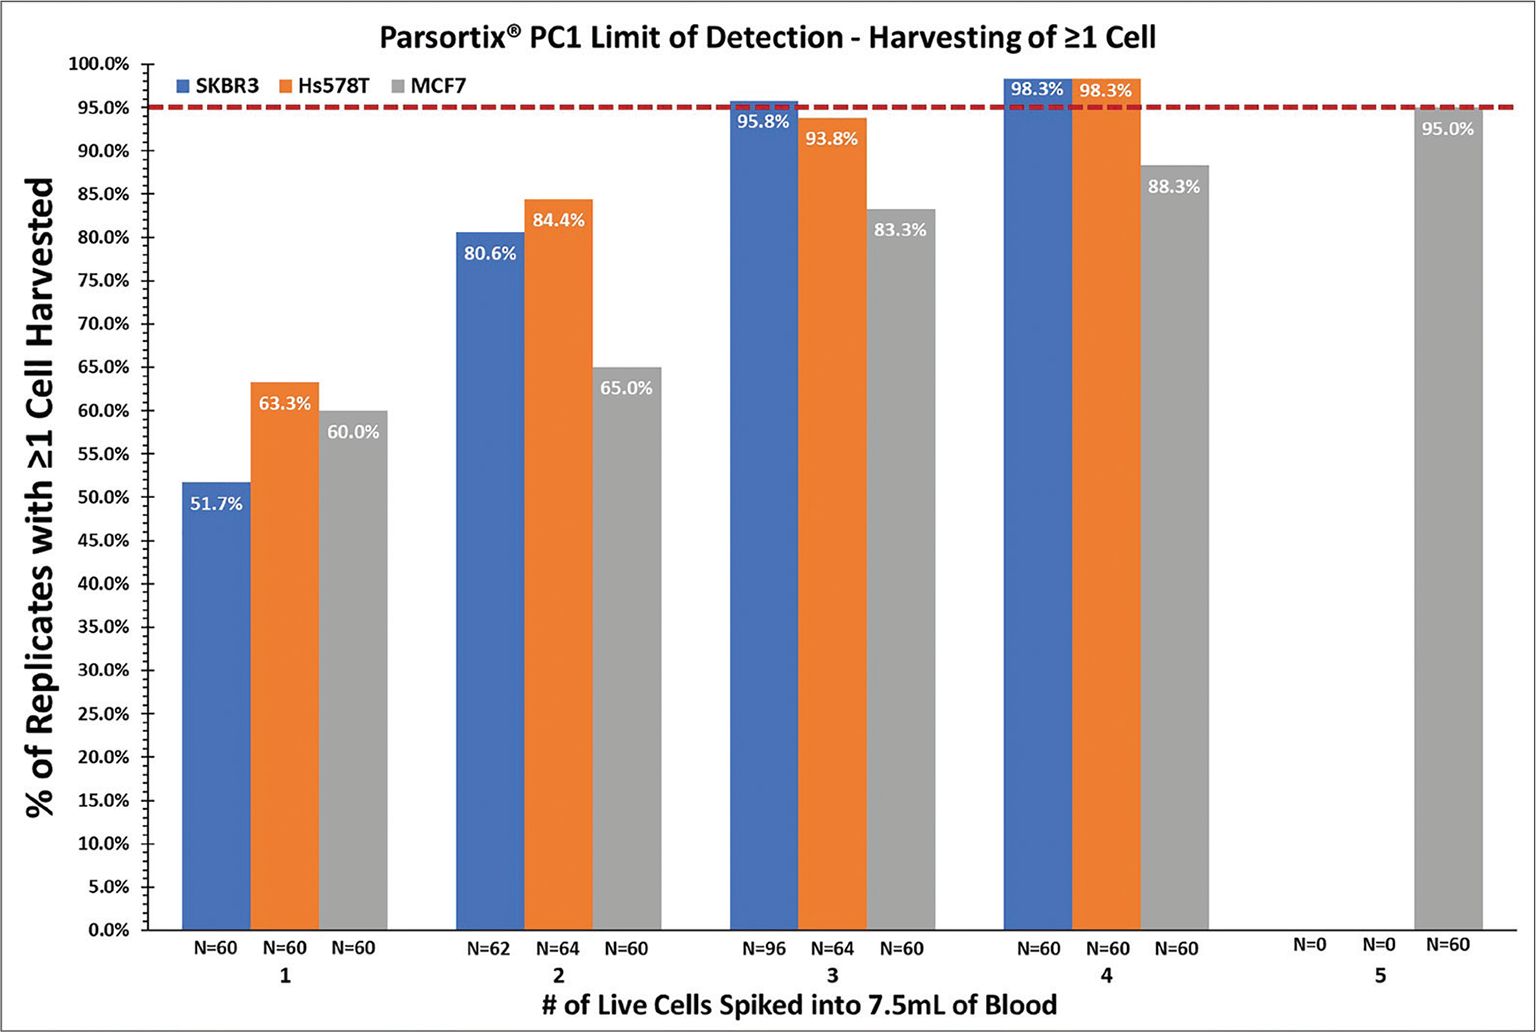
For live SKBR3 cells, the LoD was 3 cells (95.8% of the replicates spiked with 3 cells had ≥1 cell observed in the harvest); for live MCF7 cells, the LoD was 5 cells (95.0% of the replicates spiked with 5 cells had ≥1 cell observed in the harvest); and for live Hs578T cells, the LoD was 4 cells (98.3% of the replicates spiked with 4 cells had ≥1 cell observed in the harvest).
Precision
Precision studies were performed to assess the ability of the Parsortix® PC1 system to harvest multiple live breast cancer cell lines that are representative of the heterogeneity observed in breast cancer and breast cancer CTCs (30,31,32,33) at different spike levels. For each cell line (SKBR3, MCF7, and Hs578T) and spike level, 100 contrived samples consisting of live, prelabeled cells spiked into blood were processed using 10 different Parsortix® PC1 systems over 5 nonconsecutive days in each study. Imprecision estimates in these 5-day precision studies were determined for each cell line at three different spike levels (5, 10, and ~50 cells), with the cells being spiked into 7.5 mL of HV blood. The overall average harvest rates for the SKBR3, MCF7, and Hs578T cell lines were 72.0%, 70.9%, and 66.7%, respectively. The average harvest rates for each of the cell lines and cell spike levels ranged from 63.5% to 76.2%, the repeatability (within-run) %CV estimates ranged from 12.3% to 32.4%, and the reproducibility (within-laboratory) %CV estimates ranged from 13.3% to 34.1% (Tab. II). The repeatability and reproducibility %CV estimates for all of the cell line and cell spike level results combined were 26.3% (95% CI = 25.0%-27.6%) and 26.3% (95% CI = 25.2%-27.8%), respectively, with between-cell-type and between-spike-level %CV estimates of 6.6% (95% CI = 4.0%-10.6%) and 4.6% (95% CI = 1.6%-8.3%), respectively.
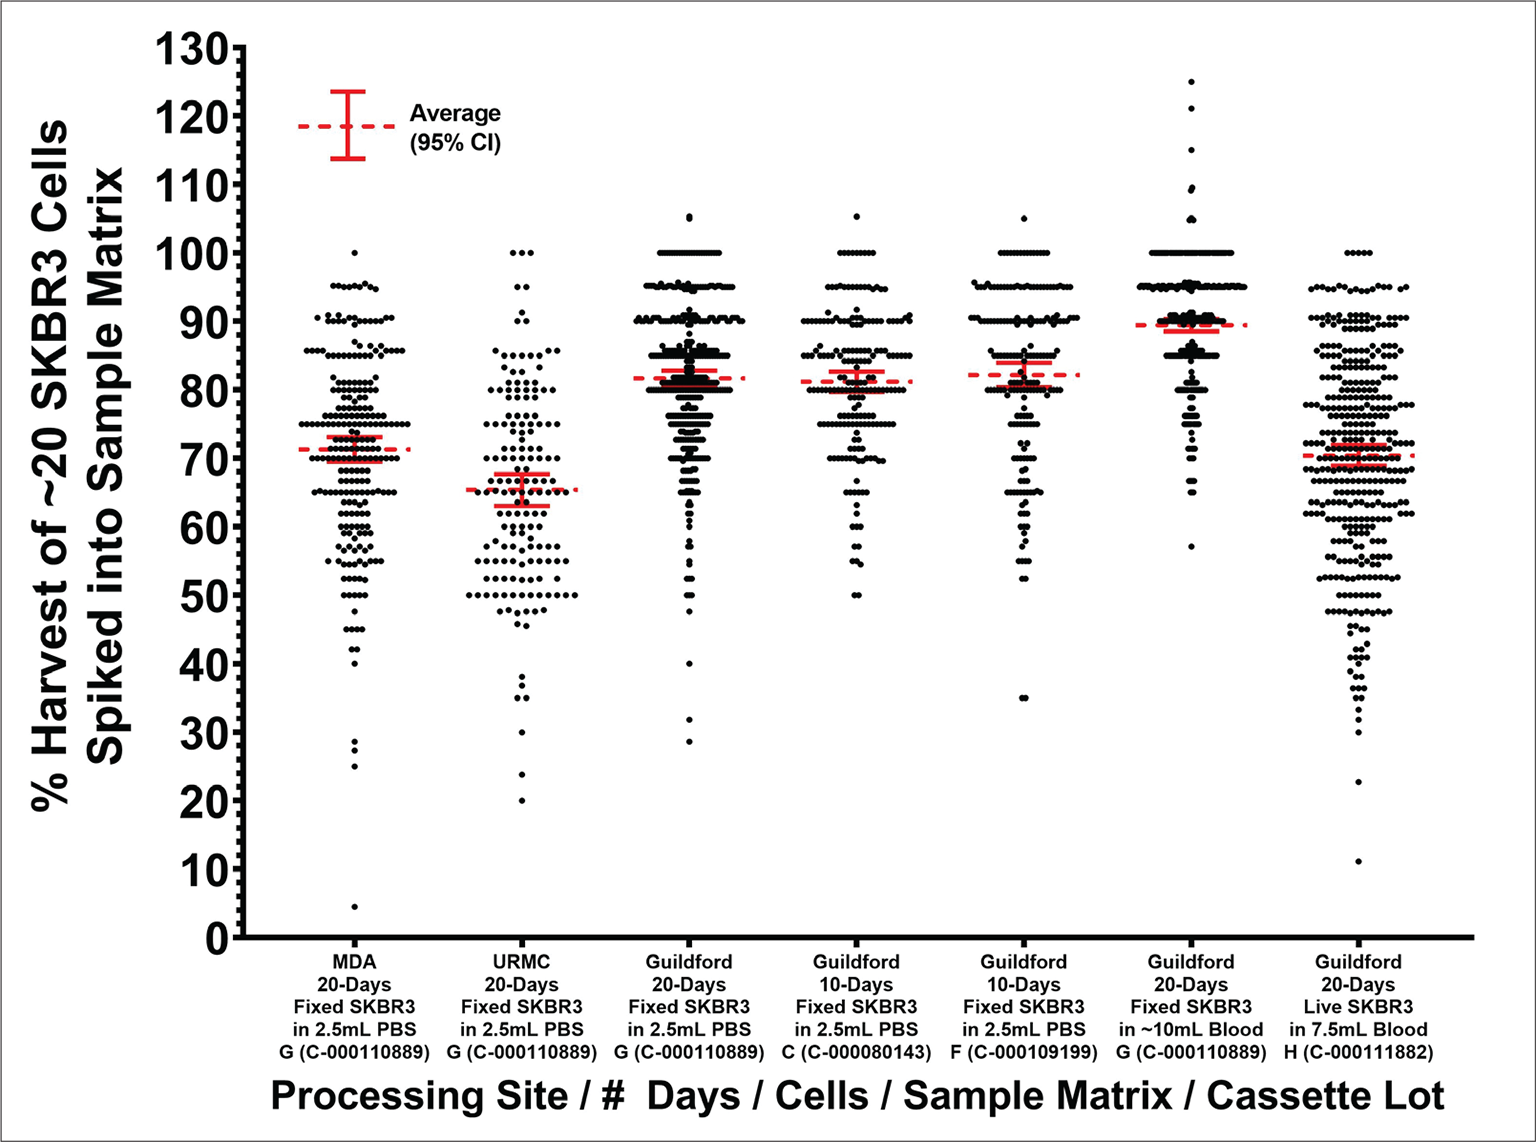
Additional precision studies were performed to evaluate the precision of the Parsortix® PC1 system for the capture and harvesting of tumor cells, taking into consideration changes in different variables including live versus fixed cells, separation cassette lots, and laboratory sites. A graphical representation of results from these additional precision studies evaluating live versus fixed cells, different cassette lots, and different laboratories can be seen in Figure 3, with further details provided in the Supplementary Materials.
Reproducibility
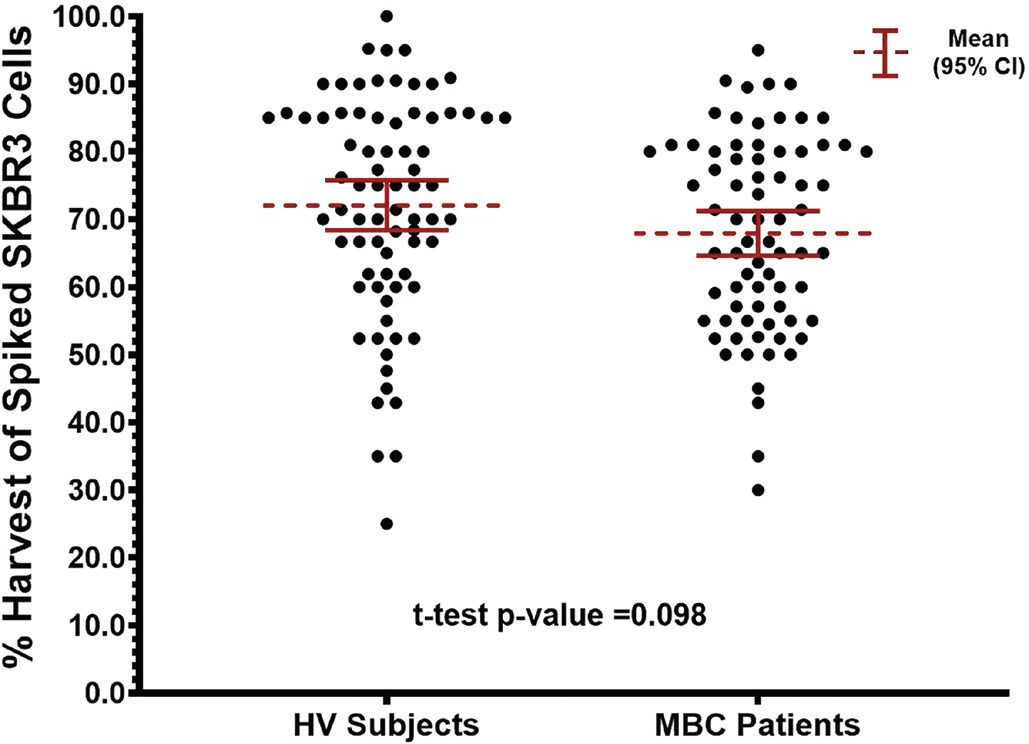
The overall combined average percentage of the ~20 prelabeled, fixed SKBR3 cells spiked into the blood samples from the 76 evaluable HV subjects and 74 evaluable MBC patients that were harvested was 70.0% ± 15.4% (95% CI = 62.3%-76.7%, median = 70.7%). The average percentage of spiked SKBR3 cells harvested in the HV subjects was 72.1% ± 16.1% (95% CI = 61.1%-80.9%, median = 75.0%) compared to 67.9% ± 14.3% (95% CI = 56.7%-77.4%, median = 68.4%) in the MBC patients (t-test p value = 0.098). Figure 4 shows a scatterplot of the percent harvest results in the HV subjects and MBC patients.
Although the average percent harvest results were not statistically significantly different between the two groups, the average percent harvest results in the MBC patients appeared to be slightly lower. As this was not expected, a possible reason for this was investigated, the results of which are described in the Supplementary Materials (Supplementary Figure 1A-B). This investigation showed significant differences in the average percent harvest results between different batches of fixed SKBR3 cells, providing evidence that the model system used in the analytical studies (i.e., cultured cell lines) contributed to the observed variabilities. This suggests that the actual imprecision of the Parsortix® PC1 system for the capture and harvest of CTCs may be lower than what was observed in these studies.
| Cell line | # of cells spiked | N | Mean % harvest | Within-run (Repeatability) | Between run | Between day | Within laboratory | ||||
|---|---|---|---|---|---|---|---|---|---|---|---|
| SD | CV% | SD | %CV | SD | %CV | SD | %CV | ||||
| Live SKBR3 | 5 | 100 | 73.6 | 22.8% | 31.0 | 6.7% | 9.1 | 0.0% | 0.0 | 23.7% | 32.2 |
| 10 | 100 | 70.4 | 18.5% | 26.3 | 0.0% | 0.0 | 4.4% | 6.3 | 19.1% | 27.1 | |
| ~50 (48-52) | 100 | 72.1 | 13.8% | 19.1 | 0.0% | 0.0 | 0.0% | 0.0 | 13.8% | 19.1 | |
| 5-~50 | 300 | 72.0 | 18.6% | 25.8 | 3.5% | 4.9 | 0.0% | 0.0 | 18.9% | 26.3 | |
| Live MCF7 | 5 | 100 | 68.0 | 22.0% | 32.4 | 7.3% | 10.7 | 1.3% | 1.9 | 23.2% | 34.1 |
| 10 | 100 | 68.4 | 18.4% | 26.9 | 0.0% | 0.0 | 6.3% | 9.2 | 19.5% | 28.5 | |
| ~50 (48-52) | 100 | 76.2 | 11.3% | 14.8 | 0.0% | 0.0 | 3.4% | 4.5 | 11.8% | 15.5 | |
| 5-~50 | 300 | 70.9 | 18.5% | 26.1 | 2.1% | 3.0 | 1.6% | 2.3 | 18.7% | 26.4 | |
| Live Hs578T | 5 | 100 | 66.6 | 19.9% | 29.9 | 5.9% | 8.9 | 3.6% | 5.4 | 21.0% | 31.5 |
| 10 | 100 | 63.5 | 17.8% | 28.0 | 0.0% | 0.0 | 7.5% | 11.8 | 19.3% | 30.4 | |
| ~50 (48-52) | 100 | 70.0 | 8.6% | 12.3 | 0.0% | 0.0 | 3.4% | 4.9 | 9.3% | 13.3 | |
| 5-~50 | 300 | 66.7 | 16.8% | 25.2 | 2.3% | 3.4 | 3.8% | 5.7 | 17.3% | 25.9 | |
| Live SKBR3, MCF7, and Hs578T | 5 | 300 | 69.4 | 22.6% | 32.6 | 3.6% | 5.2 | 0.0% | 0.0 | 22.8% | 32.9 |
| 10 | 300 | 67.4 | 18.6% | 27.6 | 0.0% | 0.0 | 3.8% | 5.6 | 19.0% | 28.2 | |
| ~50 (48-52) | 300 | 72.8 | 11.6% | 15.9 | 0.0% | 0.0 | 2.6% | 3.6 | 11.9% | 16.3 | |
| 5-~50 | 900 | 69.9 | 18.4% | 26.3 | 1.4% | 2.0 | 0.0% | 0.0 | 18.4% | 26.3 | |
ANOVA = analysis of variance; %CV = percent coefficient of variation; SD = standard deviation.
Conclusions
The analytical performance data show that the Parsortix® PC1 system harvested cultured breast cancer cells in a reproducible and linear fashion, with a minimum of 3 to 5 cells per 7.5 mL of blood required to ensure at least one cell will be harvested most of the time. The average repeatability and reproducibility %CV estimates for all of the live cell lines, chosen because they are representative of the heterogeneity expected to be seen in breast cancer CTCs, and all spike levels (5, 10, and ~50 cells) were both 26.3%, with the imprecision estimates decreasing as the number of cells spiked increased. Comparison of live and fixed SKBR3 cells showed that imprecision in the percentage of cells harvested by the system was higher when using live breast cancer cells, which was expected due to the increased deformability of live cells compared to more rigid fixed cells. This increased variability in harvest rate was also observed in the linearity data when comparing live and fixed breast cancer cells.
The analytical performance data reported here plus the previously published clinical performance data (34) were included in the submission for the de novo request for classification of the Parsortix® PC1 system (DEN200062) as a Class II medical device, which was granted by the FDA in May 2022 (Online). The Parsortix® PC1 system is the first FDA-cleared medical device for the capture and harvest of CTCs from the blood of MBC patients for subsequent, user-validated analysis.
Acknowledgments
The authors would like to acknowledge and thank all of the women who participated in the analytical and clinical studies and provided their blood samples, as well as the following individuals at each of the study sites for their contribution to the conduct of the studies, processing of samples, and evaluation of results: ANGLE Europe Limited (Study Sponsor): Ghada Abuali, Amy Davis, Marta Herreros, Arianna Hustler, Jolie Lewis, Ross Malcolm, Andrew Newland, Stefan Peter, Lara Stevanato; MD Anderson Cancer Center (Houston, TX): Gitanjali Jayachandran, James Reuben; University of Rochester Medical Center (Rochester, NY): Richard Moore, MD.
Financial disclosures
This work was fully funded by ANGLE Europe Limited. Authors AT, MCM, MJC, YG, MC, and ASPJ are employees of ANGLE. Authors DJO, TP, SGP, MDP, and MT were employees of ANGLE at the time of study conduct.
References
- 1. Markou A, Tzanikou E, Lianidou E. The potential of liquid biopsy in the management of cancer patients. Semin Cancer Biol. 2022;84:69-79. CrossRef PubMed
- 2. Russano M, Napolitano A, Ribelli G, et al. Liquid biopsy and tumor heterogeneity in metastatic solid tumors: the potentiality of blood samples. J Exp Clin Cancer Res. 2020;39(1):95. CrossRef PubMed
- 3. Pantel K, Alix-Panabières C. Liquid biopsy and minimal residual disease—latest advances and implications for cure. Nat Rev Clin Oncol. 2019;16(7):409-424. CrossRef PubMed
- 4. Rushton AJ, Nteliopoulos G, Shaw JA, Coombes RC. A review of circulating tumour cell enrichment technologies. Cancers (Basel). 2021;13(5):970. CrossRef PubMed
- 5. Lin D, Shen L, Luo M, et al. Circulating tumor cells: biology and clinical significance. Signal Transduct Target Ther. 2021;6(1):404. CrossRef PubMed
- 6. Dongre A, Weinberg RA. New insights into the mechanisms of epithelial-mesenchymal transition and implications for cancer. Nat Rev Mol Cell Biol. 2019;20(2):69-84. CrossRef PubMed
- 7. Eslami-S Z, Cortés-Hernández LE, Thomas F, Pantel K, Alix-Panabières C. Functional analysis of circulating tumour cells: the KEY to understand the biology of the metastatic cascade. Br J Cancer. 2022;127(5):800-810. CrossRef PubMed
- 8. Aceto N, Bardia A, Miyamoto DT, et al. Circulating tumor cell clusters are oligoclonal precursors of breast cancer metastasis. Cell. 2014;158(5):1110-1122. CrossRef PubMed
- 9. Seyfried TN, Huysentruyt LC. On the origin of cancer metastasis. Crit Rev Oncog. 2013;18(1-2):43-73. CrossRef PubMed
- 10. Akpe V, Kim TH, Brown CL, Cock IE. Circulating tumour cells: a broad perspective. J R Soc Interface. 2020;17(168):20200065. CrossRef
- 11. Sparano J, O’Neill A, Alpaugh K, et al. Association of circulating tumor cells with late recurrence of estrogen receptor-positive breast cancer: a secondary analysis of a randomized clinical trial. JAMA Oncol. 2018;4(12):1700-1706. CrossRef PubMed
- 12. Trapp E, Janni W, Schindlbeck C, et al; SUCCESS Study Group. Presence of circulating tumor cells in high-risk early breast cancer during follow-up and prognosis. J Natl Cancer Inst. 2019;111(4):380-387. CrossRef PubMed
- 13. Riethdorf S, Müller V, Loibl S, et al. Prognostic impact of circulating tumor cells for breast cancer patients treated in the neoadjuvant “Geparquattro” trial. Clin Cancer Res. 2017;23(18):5384-5393. CrossRef PubMed
- 14. Bidard F-C, Michiels S, Riethdorf S, et al. Circulating tumor cells in breast cancer patients treated by neoadjuvant chemotherapy: a meta-analysis. J Natl Cancer Inst. 2018;110(6):560-567. CrossRef PubMed
- 15. Janni WJ, Rack B, Terstappen LWMM, et al. Pooled analysis of the prognostic relevance of circulating tumor cells in primary breast cancer. Clin Cancer Res. 2016;22(10):2583-2593. CrossRef PubMed
- 16. Rack B, Schindlbeck C, Jückstock J, et al; SUCCESS Study Group. Circulating tumor cells predict survival in early average-to-high risk breast cancer patients. J Natl Cancer Inst. 2014;106(5):dju066. CrossRef PubMed
- 17. Ring A, Campo D, Porras TB, et al. Circulating tumor cell transcriptomics as biopsy surrogates in metastatic breast cancer. Ann Surg Oncol. 2022;29(5):2882-2894. CrossRef PubMed
- 18. Habli Z, AlChamaa W, Saab R, Kadara H, Khraiche ML. Circulating tumor cell detection technologies and clinical utility: challenges and opportunities. Cancers (Basel). 2020;12(7):1930. CrossRef PubMed
- 19. Descamps L, Le Roy D, Deman A-L. Microfluidic-based technologies for CTC isolation: a review of 10 years of intense efforts towards liquid biopsy. Int J Mol Sci. 2022;23(4):1981. CrossRef PubMed
- 20. Francart M-E, Lambert J, Vanwynsberghe AM, et al. Epithelial-mesenchymal plasticity and circulating tumor cells: travel companions to metastases. Dev Dyn. 2018;247(3):432-450. CrossRef PubMed
- 21. Bankó P, Lee SY, Nagygyörgy V, et al. Technologies for circulating tumor cell separation from whole blood. J Hematol Oncol. 2019;12(1):48. CrossRef PubMed
- 22. Miller MC, Robinson PS, Wagner C, O’Shannessy DJ. The Parsortix™ Cell Separation System—a versatile liquid biopsy platform. Cytometry A. 2018;93(12):1234-1239. CrossRef PubMed
- 23. Hvichia GE, Parveen Z, Wagner C, et al. A novel microfluidic platform for size and deformability based separation and the subsequent molecular characterization of viable circulating tumor cells. Int J Cancer. 2016;138(12):2894-2904. CrossRef PubMed
- 24. Gorges TM, Kuske A, Röck K, et al. Accession of tumor heterogeneity by multiplex transcriptome profiling of single circulating tumor cells. Clin Chem. 2016;62(11):1504-1515. CrossRef PubMed
- 25. Xu L, Mao X, Guo T, et al. The novel association of circulating tumor cells and circulating megakaryocytes with prostate cancer prognosis. Clin Cancer Res. 2017;23(17):5112-5122. CrossRef PubMed
- 26. Maertens Y, Humberg V, Erlmeier F, et al. Comparison of isolation platforms for detection of circulating renal cell carcinoma cells. Oncotarget. 2017;8(50):87710-87717. CrossRef PubMed
- 27. Koch C, Joosse SA, Schneegans S, et al. Pre-analytical and analytical variables of label-independent enrichment and automated detection of circulating tumor cells in cancer patients. Cancers (Basel). 2020;12(2):442. CrossRef PubMed
- 28. Zavridou M, Mastoraki S, Strati A, et al. Direct comparison of size-dependent versus EpCAM-dependent CTC enrichment at the gene expression and DNA methylation level in head and neck squamous cell carcinoma. Sci Rep. 2020;10(1):6551. CrossRef PubMed
- 29. Chudziak J, Burt DJ, Mohan S, et al. Clinical evaluation of a novel microfluidic device for epitope-independent enrichment of circulating tumour cells in patients with small cell lung cancer. Analyst (Lond). 2016;141(2):669-678. CrossRef PubMed
- 30. Gong Y, Liu Y-R, Ji P, Hu X, Shao Z-M. Impact of molecular subtypes on metastatic breast cancer patients: a SEER population-based study. Sci Rep. 2017;7(1):45411. CrossRef PubMed
- 31. Yu M, Bardia A, Wittner BS, et al. Circulating breast tumor cells exhibit dynamic changes in epithelial and mesenchymal composition. Science. 2013;339(6119):580-584. CrossRef PubMed
- 32. Dai X, Cheng H, Bai Z, Li J. Breast cancer cell line classification and its relevance with breast tumor subtyping. J Cancer. 2017;8(16):3131-3141. CrossRef PubMed
- 33. Liu K, Newbury PA, Glicksberg BS, et al. Evaluating cell lines as models for metastatic breast cancer through integrative analysis of genomic data. Nat Commun. 2019;10(1):2138. CrossRef PubMed
- 34. Cohen EN, Jayachandran G, Moore RG, et al. A multi-center clinical study to harvest and characterize circulating tumor cells from patients with metastatic breast cancer using the Parsortix® PC1 system. Cancers (Basel). 2022;14(21):5238. CrossRef PubMed
- 35. Coumans FAW, van Dalum G, Beck M, Terstappen LWMM. Filter characteristics influencing circulating tumor cell enrichment from whole blood. PLoS One. 2013;8(4):e61770. CrossRef PubMed
- 36. Zhao W, Liu Y, Jenkins BD, et al. Tumor antigen-independent and cell size variation-inclusive enrichment of viable circulating tumor cells. Lab Chip. 2019;19(10):1860-1876. CrossRef PubMed
- 37. Hao S-J, Wan Y, Xia Y-Q, Zou X, Zheng S-Y. Size-based separation methods of circulating tumor cells. Adv Drug Deliv Rev. 2018;125:3-20. CrossRef PubMed
- 38. Coumans F, van Dalum G, Terstappen LWMM. CTC technologies and tools. Cytometry A. 2018;93(12):1197-1201. CrossRef PubMed