|
J Circ Biomark 2023; 12: 17-25 ISSN 1849-4544 | DOI: 10.33393/jcb.2023.2502 REVIEW |
Laboratory biomarkers of delayed cerebral ischemia following subarachnoid hemorrhage: A systematic review
ABSTRACT
Delayed cerebral ischemia (DCI) substantially contributes to disability and death in subarachnoid hemorrhage (SAH) patients; however, its pathophysiology is incompletely understood and diagnostic and therapeutic strategies are lacking. Biomarkers may help to elucidate the pathophysiology, optimize early diagnosis, or provide treatment targets. We systematically searched PubMed and Embase on October 13, 2021, for studies that evaluated at least one laboratory biomarker in patients with DCI, using the most up-to-date definition of DCI as proposed by a panel of experts in 2010. Quality of studies was assessed using the Newcastle-Ottawa Scale or Cochrane Collaboration’s risk of bias assessment tool. Biomarkers of clinical and radiological DCI were analyzed separately. Results were meta-analyzed if possible, otherwise narratively reviewed. Biomarkers were classified as significant, inconclusive, or nonsignificant. We defined validated biomarkers as those with significant results in meta-analyses, or in at least two studies using similar methodologies within the same time interval after SAH. The search yielded 209 articles with 724 different biomarkers; 166 studies evaluated 646 biomarkers of clinical DCI, of which 141 were significant and 7 were validated biomarkers (haptoglobulin 2-1 and 2-2, ADAMTS13, vWF, NLR, P-selectin, F2-isoprostane); 78 studies evaluated 165 biomarkers of radiological DCI, of which 63 were significant and 1 was a validated biomarker (LPR). Hence, this review provides a selection of seven biomarkers of clinical DCI and one biomarker of radiological DCI as most promising biomarkers of DCI. Future research should focus on determining the exact predictive, diagnostic, and therapeutic potentials of these biomarkers.
Keywords: Biomarker, Delayed cerebral ischemia, Subarachnoid hemorrhage
Received: October 8, 2022
Accepted: March 20, 2023
Published online: April 5, 2023
This article includes supplementary material
Journal of Circulating Biomarkers - ISSN 1849-4544 - www.aboutscience.eu/jcb
© 2023 The Authors. This article is published by AboutScience and licensed under Creative Commons Attribution-NonCommercial 4.0 International (CC BY-NC 4.0).
Commercial use is not permitted and is subject to Publisher’s permissions. Full information is available at www.aboutscience.eu
Introduction
Delayed cerebral ischemia (DCI) is an important and potentially preventable contributor to disability and death in subarachnoid hemorrhage (SAH) patients in whom the causative aneurysm has been obliterated (1,2). The pathophysiology of DCI is complex and multifactorial; however, it is not yet fully understood. As a result, an accurate diagnostic test and effective treatment are both lacking.
Biomarkers may not only help to further elucidate the pathophysiology of DCI, but could also aid in optimizing early diagnosis and prompt treatment. Even though the present literature is brimmed with biomarker studies of DCI, accurate biomarkers of DCI have not yet been established. In 2018, an extensive systematic review proposed a panel analysis of 6 selected genetic and 15 protein biomarker candidates for further prospective validation of DCI prediction (3). However, this review used a very broad definition of DCI, including also DCI defined solely as angiographic vasospasm on digital subtraction angiography or increased flow velocities on transcranial Doppler (TCD) ultrasonography. Historically, angiographic vasospasm was considered the sole cause of DCI; however, in the past decades research has shown that DCI and vasospasms are two different entities (4). Therefore, the combined use of both vasospasm and DCI in the 2018 review may have misguided the selected panel of biomarkers.
In 2010, a panel of experts proposed a strict definition of DCI, divided into a clinical and radiological definition, to be used as outcome measure and to enable more reliable meta-analyses of future clinical trials and observational studies (4). We used these definitions of DCI to systematically review the current literature on laboratory biomarkers of DCI and selected a new panel of the most promising biomarkers. The selected biomarkers may be useful for the prediction or diagnosis of DCI, either individually or combined.
Methods
The Preferred Reported Items for Systematic Review and Meta-analysis (PRISMA) 2020 guidelines were followed. This review was not registered and a review protocol was not prepared.
Search strategy and selection criteria
PubMed and Embase were searched for relevant studies from January 1, 1985, to October 13, 2021. The search strategy can be found in the supplemental data (Supplementary material, page 2-3). Two authors (MAT and HL) independently selected eligible studies. Titles and abstracts were screened for potential eligibility when covering primary studies on biomarkers of DCI in SAH patients either written in Dutch or English. Of the selected studies, full texts were screened and studies were considered eligible if they met the following criteria: (1) patients with SAH of whom (2) at least 95% were diagnosed with a causative aneurysm, (3) measurement of at least one laboratory biomarker (4) during hospital admission, (5) using either the radiological or clinical definition of DCI as proposed in 2010 (criteria listed in Tab. I), and (6) the studies had to perform, or allow for, statistical analysis on the biomarker in question and DCI. Exclusion criteria were: (1) studies with mixed clinical and radiological DCI cohorts, in which patients with either clinical or radiological DCI could not be distinguished from the mixed cohort, (2) biomarker levels in patients with and without DCI were inconsistent (e.g., different numbers in tables/figures and text), (3) no level of statistical significance was given, nor could be calculated, (4) studies in children only, (5) the same patient population (similar years and hospital of patient inclusion) was used by more than one study and, within those studies, the same biomarker was measured and compared similarly between DCI and no DCI patients. In this case, the study with the smallest sample size, and if sample sizes were equal the most outdated study, was excluded. Lastly, we checked studies on nimodipine administration. In 1988 and 1989, two randomized controlled trials showed efficacy of nimodipine in preventing DCI, resulting in a shift in SAH management (5,6). Therefore, we excluded studies with SAH patients before 1985. SAH cohorts between 1985 and 1990 were only included if nimodipine administration was explicitly mentioned. All papers after 1990 were included, unless nimodipine was described explicitly as being not part of the treatment protocol.
| Clinical DCI | |
|---|---|
| Defined as:
• A decrease in level of consciousness (described by a decrease of the Glasgow Coma Scale score or an increase of the National Institutes of Health Stroke Scale score) or • Focal neurological impairment (e.g., aphasia, motor impairment, sensory deficits, neglect) |
Excluded if:
• Vague definitions of DCI, e.g., “clinical deterioration,” “neurological deterioration,” “worsening of neurological condition,” without specifically mentioning either decreased level of consciousness or focal neurological impairment • The DCI cohort also includes patients with solely signs of vasospasm without clinical symptoms of DCI. For example, patients with: • Arterial narrowing on CT-A or DSA • Increased flow velocities on TCD |
| Radiological DCI | |
| Defined as:
• New ischemia/infarction/stroke or • Secondary ischemia/infarction/stroke or • Ischemia/infarction/stroke due to DCI (or associated DCI terms, including delayed ischemic/neurological deficit, [clinical] vasospasm, secondary ischemia/infarction) |
Excluded if:
• Defined as “presence of ischemia/infarction/stroke” without defining “new,” “secondary,” or “due to DCI/associated terms of DCI” • Presence of ischemia/infarction/stroke determined by an imaging modality other than noncontrast CT or MRI, e.g., CT perfusion, CT-A) • Other nonimaging methods used to assess ischemia/infarction/stroke, e.g., brain tissue oxygenation monitoring and microdialysate biomarkers |
CT = computed tomography; CT-A = CT-angiography; DCI = delayed cerebral ischemia; DSA = digital subtraction angiography; MRI = magnetic resonance imaging; TCD = transcranial Doppler.
Data extraction
The same authors (MAT and HL) independently extracted baseline SAH characteristics (age, gender, World Federation of Neurological Societies [WFNS] grade and Fisher grade), the study’s definition of DCI, the number of patients with and without DCI, and biomarker-related data.
If studies addressed both clinical and purely radiological DCI separately, biomarker-related data were extracted for both definitions. The biomarker-related data concerned laboratory biomarkers only (clinical and radiological biomarkers [heart rate, blood pressure, temperature, TCD velocities, computed tomography (CT) perfusion variables etc.] were left out of consideration). Biomarker data had to concern levels of individual biomarkers or ratios of two biomarkers, that is, combinations of three or more biomarkers, such as decision tree analysis or a self-made calculated score based on multiple biomarkers, were left out of consideration. Data included the biomarker medium (blood, cerebrospinal fluid [CSF], microdialysate [MD], urine, or other), timing of measurement(s), and all statistical analyses regarding the biomarker and the occurrence of DCI. If the biomarker medium was not mentioned, it was assumed to be blood. A biomarker measured in multiple media, for example, in blood and CSF, was considered as two separate biomarkers.
Nongenetic biomarkers were stratified into biomarker groups, which were based on the multifactorial pathophysiology of DCI as described by a previously published systematic review (7). Of biomarkers with multiple functions, we aimed to select the function which the authors of the study considered as DCI-related and subsequently categorized the biomarker into that specific biomarker group. Nongenetic biomarkers which could not be stratified to any biomarker group related to the pathophysiology of DCI were categorized as “other.” Within the “other” group, we aimed to cluster biomarkers with similar functions. Genetic biomarkers were categorized as a separate group. The extracted data were compared and discrepancies were discussed with a third author (DV) and solved.
Quality assessment
Two authors (MAT and DV) independently assessed the quality of included studies using the Newcastle-Ottawa Scale (NOS) for case control and cohort studies and the Cochrane Collaboration’s risk of bias assessment tool for randomized trials. Studies could obtain a maximum of eight or nine points, depending on the use of a nonexposed cohort. The Cochrane Collaboration’s risk of bias assessment tool comprises seven criteria, which can be scored as high, low, or unclear risk of bias. Discrepancies were discussed with a third opinion (WPV) and solved.
Data interpretation and analysis
Biomarkers of clinical DCI (primary outcome) were analyzed separately from biomarkers of radiological DCI (secondary outcome). We categorized biomarkers into significant and nonsignificant biomarkers. Biomarkers, which were studied by one study only, were considered significant if at least one measurement was significantly associated with DCI (p < 0.05) and nonsignificant if all measurements yielded nonsignificant results. If a biomarker was investigated by more than one study, the classification into significant and nonsignificant was either based on a biomarker-specific meta-analysis, if methodologically possible (similar type of analyses and timing of measurement), or by descriptive comparison. Meta-analyses were performed only if all relevant studies, which investigated the biomarker in question on a specific point in time after SAH, could be included, using Review Manager 5.4. For continuous data we used the inverse variance method with random effects model to calculate weighted mean differences with 95% confidence intervals. For dichotomous data we used the Mantel-Haenszel method with random effects model to calculate estimated odds ratio with 95% confidence intervals. A pooled effect size was estimated for each specific timing of biomarker measurement. Descriptive comparison of the studies was done by summarizing the results of all relevant studies in a biomarker-specific figure, which was then used to classify the biomarkers into significant, inconclusive, and nonsignificant. The biomarker-specific figures display the author, year, number of patients with and without DCI, the type of analyses, and the results divided into categories of sampling timing (day 0-3, 4-8, 9-13, and >14 after SAH). The method used for classification of biomarkers into significant, inconclusive, and nonsignificant based on the biomarker-specific figures is explained in the supplemental data (Supplementary material, page 4).
In order to select the most promising biomarkers of DCI, we evaluated whether significant biomarkers were validated by a second study. A validated biomarker was defined as a biomarker with significant results in at least two studies using similar methodologies within the same time interval after SAH, without any other study showing contradictory results. Biomarkers of which the meta-analysis of all relevant studies yielded a significant association were considered validated, too. Additionally, biomarkers that had only been investigated by one study were differentiated from those biomarkers that were investigated by a high-quality study. We defined high quality as a maximum (eight or nine) or maximum minus one point (seven out of eight or eight out of nine) quality assessment score.
Data have been reported according to the PRISMA reporting guidelines for systematic reviews and meta-analyses.
Results
Included studies
After removing duplicates, the search yielded a total of 5,820 studies. We excluded 3,900 studies during abstract screening and 1,711 studies during full-text screening, after which 209 articles (204 cohort and 4 case-control studies, 1 randomized controlled trial) remained (Fig. 1). Baseline characteristics of all included studies are listed in Table S1 of the supplemental data (Supplementary material, page 5-12). Altogether, the 209 studies measured 724 different biomarkers in 25,933 SAH patients (not corrected for overlapping patient cohorts). A summary of the NOS quality scores is listed in Table II, and the quality scores of individual studies are displayed in the baseline characteristics table (Table S1, page 5-12). The four case-control studies scored three, four (n = 2) and seven of nine points. The randomized controlled trial scored low risk on three of seven items.
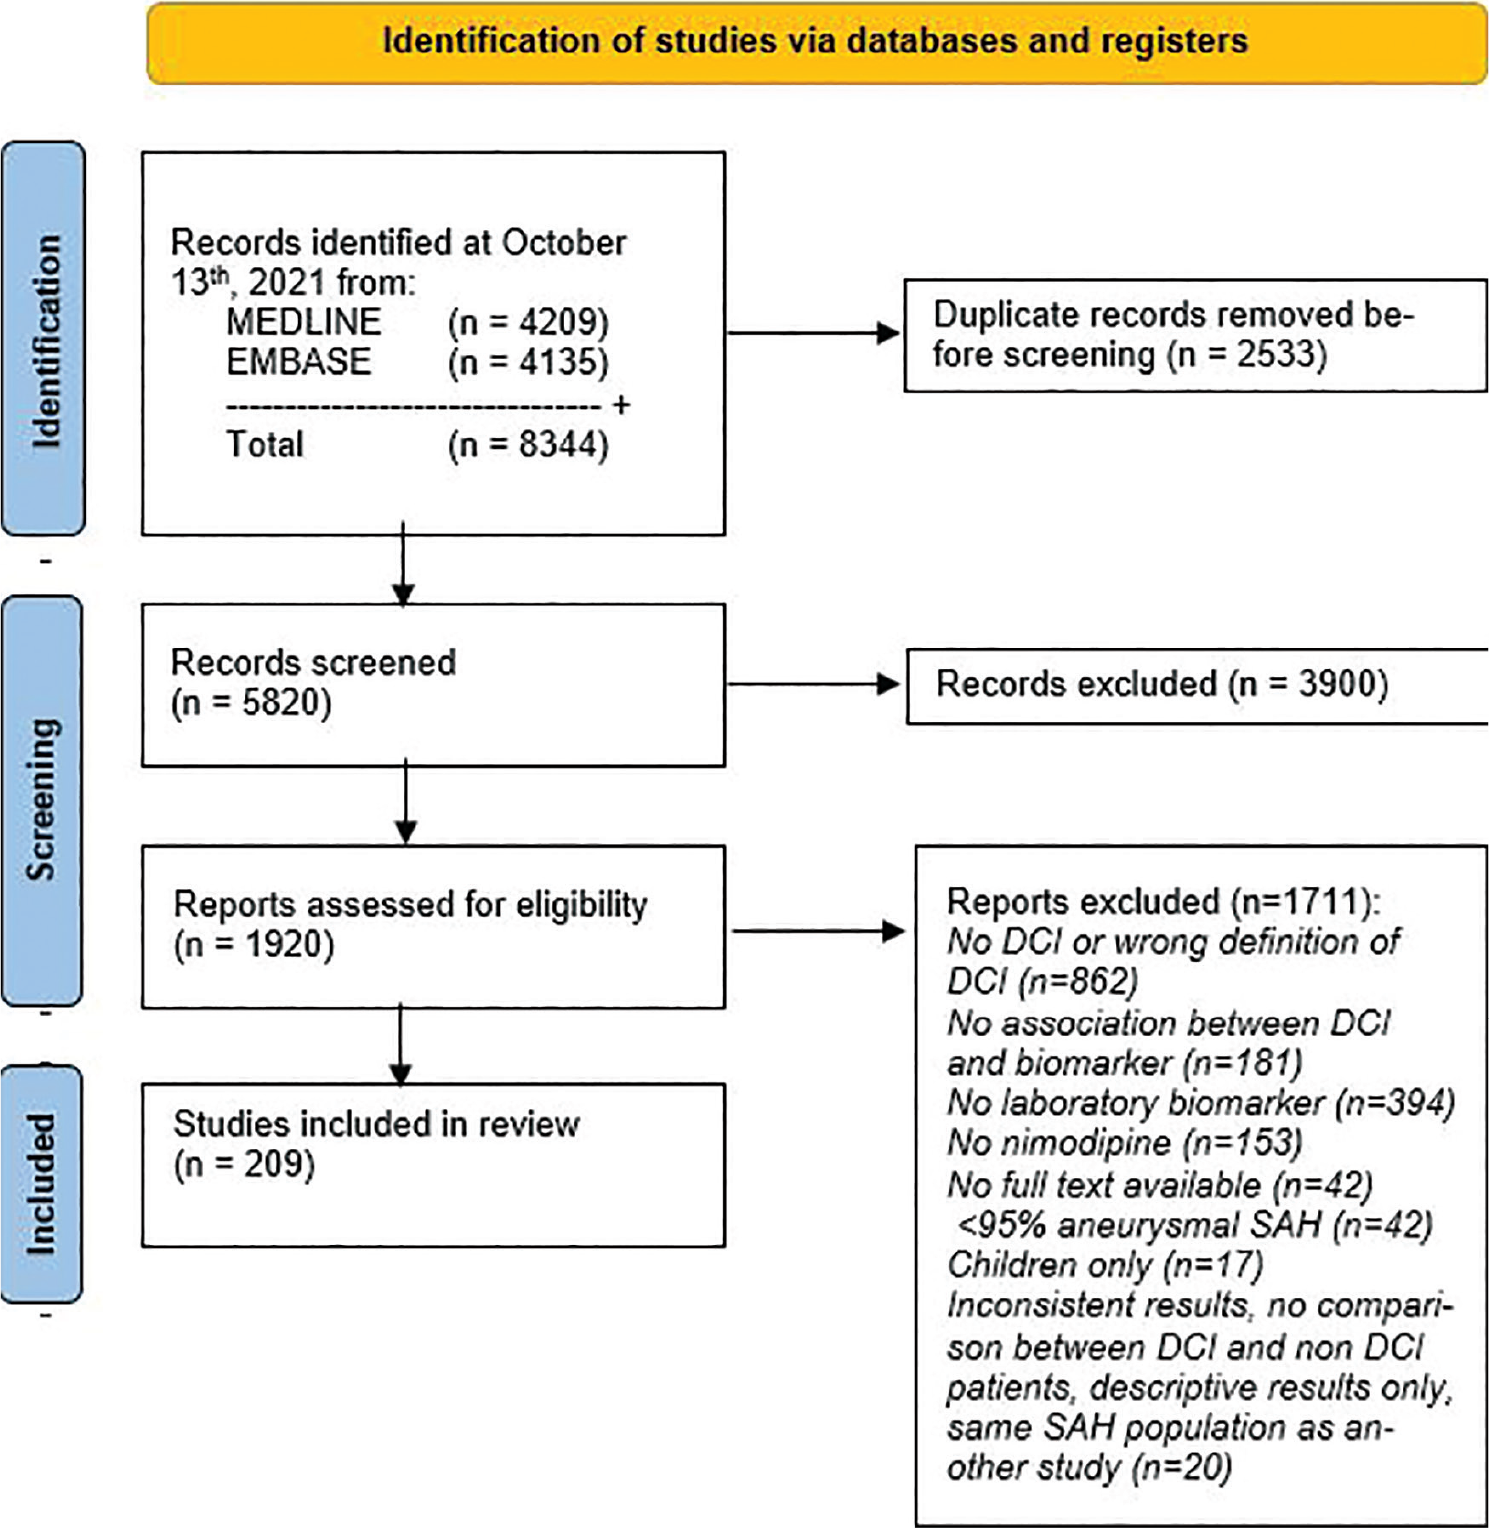
Fig. 1 - PRISMA 2020 flow diagram for systematic reviews.
Clinical DCI
Biomarkers of clinical DCI were studied by 166 studies comprising 646 different biomarkers (Fig. 2) in 20,983 SAH patients of whom 5,810 (28%) developed DCI. Most biomarkers (588 of 646, 91%) were investigated by one study and 58 (9%) by more than one study (range 2 to 14, median 3). The distribution of the biomarkers among the biomarker groups is shown in Table III.
In total, 141 biomarkers (n = 88 nongenetic, n = 53 genetic) were classified as significantly associated with clinical DCI (Table S2, page 13-34). A summary of studied and significant biomarkers and specific trends observed within each biomarker group are displayed in Table III. Of the significant biomarkers, 121 were investigated by one study and 20 by more than one study. Meta-analyses were possible for five biomarkers (haptoglobin 1-1, 2-1, and 2-2, ADAM metallopeptidase with thrombospondin type 1 motif 13 [ADAMTS13] and von Willebrand factor [vWF]). The meta-analyses showed that SAH patients with haptoglobin polymorphism 2-1 were less likely to develop DCI and patients with haptoglobin polymorphism 2-2 were more likely to develop DCI (8,9,10). DCI patients had lower ADAMTS13 levels on day 1 and higher levels of vWF on day 4 after SAH, compared to patients without DCI, in two studies (11,12). The results of the remaining 53 significant biomarkers that were investigated by multiple studies that could not be meta-analyzed were summarized in biomarker-specific figures. Based on the biomarker-specific figures, three other biomarkers (neutrophil/lymphocyte ratio [NLR] and P-selectin in blood and F2-isoprostane in urine) had significant results in two or more studies using similar methodologies and timing of measurement, and were considered validated biomarkers. Four studies on NLR showed a proinflammatory state on admission and preoperatively in patients with DCI compared to patients without DCI (13,14,15,16). P-selectin, a marker of endothelial activation, was found to have a significantly larger increase during DCI onset, compared to paired samples in the non-DCI group in two studies (17,18). F2-isoprostane in urine on day 3 after SAH was significantly associated with the occurrence of DCI in two studies (19,20). The quality of studies from which we found the seven validated biomarkers is listed in Table IV. Both meta-analyses and biomarker-specific figures can be found in the supplemental data (Supplementary material, Figure S1-S58, page 35-45).
| Quality score | 134 studies without control group (maximum 8 points) | 70 studies with control group (maximum 9 points) |
|---|---|---|
| 1 point | None | None |
| 2 points | 7 studies | 2 studies |
| 3 points | 24 studies | 8 studies |
| 4 points | 20 studies | 16 studies |
| 5 points | 35 studies | 20 studies |
| 6 points | 34 studies | 14 studies |
| 7 points | 10 studies | 7 studies |
| 8 points | 4 studies | 3 studies |
| 9 points | – | None |
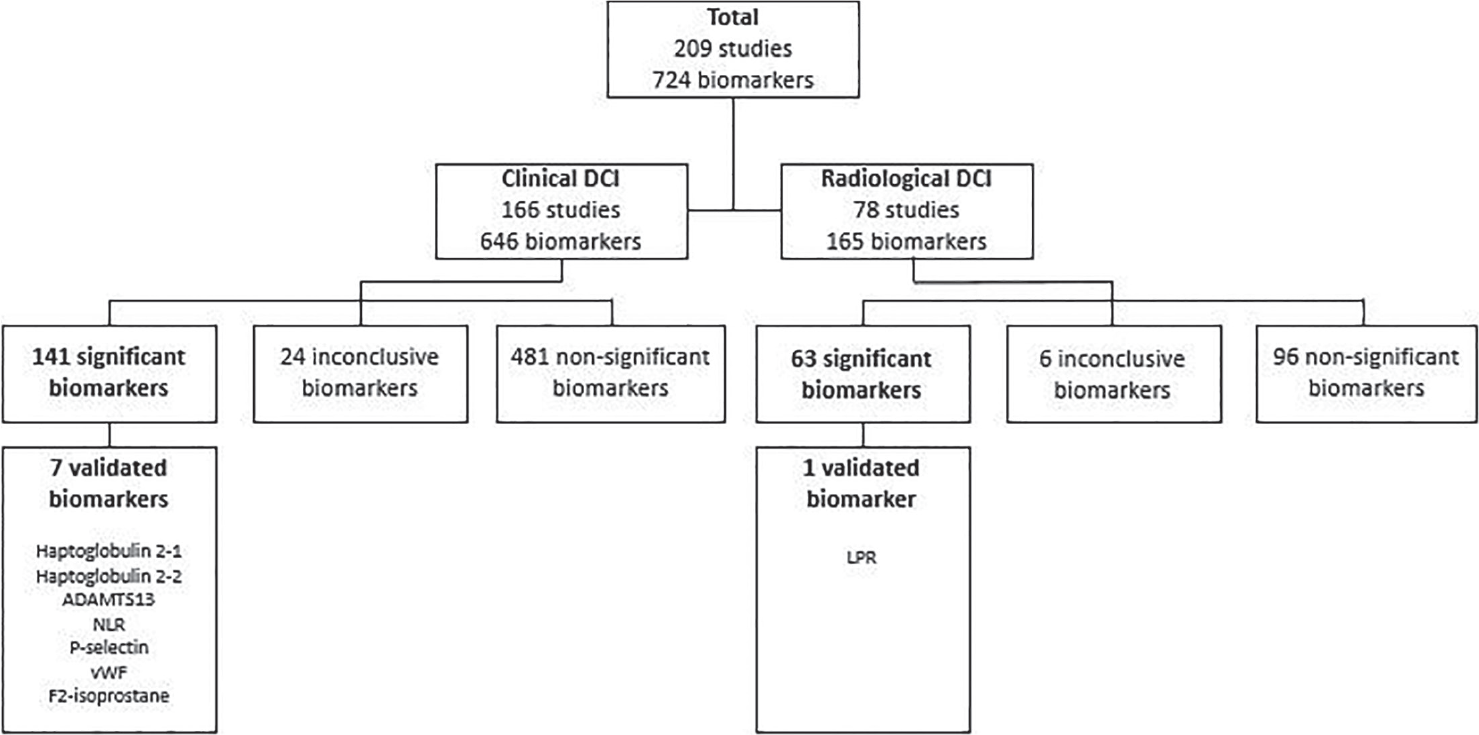
Fig. 2 - Flowchart of all biomarkers, divided into clinical and radiological DCI. ADAMTS13 = ADAM metallopeptidase with thrombospondin type 1 motif 13; LPR = lactate/pyruvate ratio; NLR = neutrophil/lymphocyte ratio; vWF = von Willebrand factor.
| Biomarker group | Biomarkers of clinical DCI | Specific trends observed among significant biomarkers within biomarker group | |
|---|---|---|---|
| Studied | Significant | ||
| Nongenetic biomarkers | 225 | 88 | |
| Brain injury | 16 | 8 | All indicated more brain injury in patients with DCI. No specific trend in time. |
| Coagulation cascade | 33 | 15 | All indicated increased platelet activity, hypercoagulability, or hyperfibrinolysis. No specific trend in time. |
| Cortical spreading depressions | 2 | 1 | Excitotoxicity in first 48 h after SAH. |
| Endothelial injury | 3 | 2 | Both indicated more endothelial injury in DCI. |
| Inflammation and immune system | 83 | 29 | 25 of 29 biomarkers indicated enhanced inflammation or immune response. Most frequently observed in first couple of days following SAH. |
| Oxidative stress | 18 | 7 | 5 of 7 biomarkers indicated increased oxidative stress in patients with DCI. No specific trend in time. |
| Vascular tone | 22 | 9 | 6 of 9 biomarkers indicated vasoconstriction, 2 indicated vasodilation, 1 was significant with unknown point estimate. |
| Volemic status | 10 | 2 | Both increased and decreased diuresis and natriuresis were observed in DCI. |
| Other | 38 | 14 | Subcategories were: cerebral metabolism, gender-specific growth factors, lipid metabolism, oxygen-carrying capacity, and stress response. |
| Genetic biomarkers | 421 | 53 | |
| Genomic MicroRNA Methylation Polymorphism RNA Single nucleotide polymorphism |
5 51 44 13 15 293 |
1 0 36 3 6 7 |
Function often unclear, some were involved in processes of oxidative stress, vascular tone, volemic status, stress response, inflammation and coagulation, among others. |
DCI = delayed cerebral ischemia; RNA = ribonucleic acid; SAH = subarachnoid hemorrhage.
| Validated biomarker | Studies | Quality of studies |
|---|---|---|
| Clinical DCI | ||
| ADAMTS13 | Li, 2017 (11) Tang, 2015 (12) |
3/8 4/9 |
| F2-isoprostane | Wiśniewski, 2020 (19) Wiśniewski, 2017 (20) |
6/9 6/9 |
| Haptoglobulin 2-1 | Kim, 2018 (8) Leclerc, 2015 (9) Ohnishi, 2014 (10) |
3/8 5/8 6/8 |
| Haptoglobulin 2-2 | Kim, 2018 (8) Leclerc, 2015 (9) Ohnishi, 2014 (10) |
3/8 5/8 6/8 |
| NLR | Liu, 2020 (13) Al-Mufti, 2019 (14) Wu, 2019 (16) Tao, 2017 (15) |
6/8 6/8 7/8 5/8 |
| P-selectin | Wang, 2011 (17) Frijns, 2006 (36) |
7/9 5/8 |
| vWF | Li, 2017 (11) Tang, 2015 (12) |
3/8 4/9 |
| Radiological DCI | ||
| LPR | Kofler, 2020 (26) Torné, 2020 (27) |
4/8 2/8 |
ADAMTS13 = ADAM metallopeptidase with thrombospondin type 1 motif 13; DCI = delayed cerebral ischemia; LPR = lactate/pyruvate ratio; NLR = neutrophil/lymphocyte ratio; vWF = von Willebrand factor.
Among the 121 significant biomarkers investigated by one study only, 5 (n = 4 nongenetic, n = 1 genetic) biomarkers were investigated by high-quality studies: brain natriuretic peptide (21), osteopontin (22), tenascin C (23), and neutrophil/albumin ratio (24) in blood and endothelial nitric oxide synthase (SNP rs2070744 T-786C) using buccal swabs (25).
Radiological DCI
Biomarkers of radiological DCI were studied by 78 studies comprising 165 different biomarkers (Fig. 2) in 10,282 SAH patients of whom 2,254 (22%) developed DCI. Most biomarkers (146 of 165, 88%) were investigated by one study and 19 (12%) by more than one study (range 2 to 8, median 2). The distribution of the biomarkers among the biomarker groups is shown in Table V.
In total, 63 biomarkers (n = 39 nongenetic, n = 24 genetic) were classified as significantly associated with radiological DCI (Supplementary material, Table S2, page 13-34). A summary of the studied and significant biomarkers and specific trends observed within each biomarker group is given in Table V. Of the significant biomarkers, 56 were investigated by one study and 7 by multiple studies. Meta-analyses were not possible. Based on the biomarker-specific figures, one biomarker, lactate/pyruvate ratio (LPR) in blood, was considered validated as two independent studies showed that an LPR higher than 40 was associated with DCI, measured during the first weeks following SAH (26,27). The quality of the two studies on LPR was 4/8 and 2/8 (Table 4). The biomarker-specific figures can be found in the supplemental data (Supplementary material, Figure S59-S77, page 46-48).
Among the 56 significant biomarkers investigated by one study, 7 nongenetic blood biomarkers were investigated by a high-quality study: monocyte LFA-1, monocyte Mac-1, monocyte PSGL-1, neutrophil LFA-1, neutrophil Mac-1, neutrophil PSGL-1, and osteopontin (22,28).
Clinical vs. Radiological DCI
Of all biomarkers, 89 were studied for both clinical and radiological DCI (Supplementary material, Table S2, page 13-34). Eight blood biomarkers were significantly associated with both clinical and radiological DCI (d-dimer, platelet activating factor, interleukin-17, lectin complement pathway activity, osteopontin, brain natriuretic peptide, urea/creatinine ratio and serine proteinase inhibitor family E member 1 SNP rs2227631 + rs1799889 + rs6092 + rs6090 + rs2227684 + rs7242). Forty-five biomarkers were classified as nonsignificant for both clinical and radiological DCI. Of the remaining 36 biomarkers, the classification into significant, inconclusive, or nonsignificant differed between clinical and radiological DCI.
Discussion
This review has selected seven biomarkers of clinical DCI (haptoglobin polymorphisms 2-1 and 2-2, ADAMTS13, NLR, P-selectin, and vWF in blood and F2-isoprostane in urine) and one biomarker of radiological DCI (LPR in MD) as most promising biomarkers of DCI. Of note, the majority of significant biomarkers (121/141 of clinical DCI and 56/63 of radiological DCI) were only evaluated by one study, and although being potential biomarkers, especially the 12 biomarkers from high-quality studies, are in need of validation.
In 2018, a review on biomarkers of DCI yielded a panel of 21 predictive biomarkers (3); however, this review had three substantial limitations, which may have misguided the selected panel of biomarkers: (1) patients with solely angiographic vasospasm and increased flow velocities on TCD ultrasound, as indication of DCI, were also included, (2) the results of biomarkers measured in different media (CSF and blood) were combined, and (3) no differentiation between predictive and diagnostic biomarkers was made. In our present review, the most up-to-date definition of DCI was strictly applied during the selection of eligible articles and a biological substance measured in multiple media was considered a separate biomarker for each medium. As a result, our review yielded less studies (209 vs. 270). Although we found more biomarkers (724 vs. 257), our review yielded only eight validated biomarkers, as opposed to 21 by Jabbarli et al., of which two (ADAMTS13 and NLR) were in agreement (3). The discrepancy between the panels of biomarkers selected by both reviews emphasizes the importance of a uniform definition of DCI, especially in the absence of solid diagnostic criteria.
| Biomarker group | Biomarkers of radiological DCI | Specific trends observed among significant biomarkers within biomarker group | |
|---|---|---|---|
| Studied | Significant | ||
| Nongenetic biomarkers | 100 | 39 | |
| Brain injury | 6 | 2 | All indicated more brain injury in patients with DCI. No specific trend in time. |
| Coagulation cascade | 16 | 9 | All four biomarkers of primary hemostasis indicated increased platelet activation/aggregation, three of four secondary hemostasis biomarkers showed hypercoagulability, one biomarker showed hyperfibrinolysis in patients with DCI. No specific trend in time. |
| Cortical spreading depressions | – | – | – |
| Endothelial injury | 4 | 2 | Both biomarkers indicated increased endothelial injury in DCI. |
| Inflammation and immune system | 33 | 15 | 12 of 15 inflammation and immune system markers indicated increased inflammation and elevated immune response in patients with DCI. No specific trend in time. |
| Oxidative stress | 4 | 2 | Both biomarkers indicated increased oxidative stress in patients with DCI. |
| Vascular tone | 8 | 1 | Vasoconstriction between days 0 and 14 after SAH in DCI. |
| Volemic status | 2 | 2 | More diuresis and natriuresis were observed in DCI. More DCI in hyponatremia vs. no hyponatremia. |
| Other | 27 | 6 | Subcategories were: angiogenesis, cerebral metabolism, lipid metabolism, stress response, and protein metabolism. |
| Genetic biomarkers | 63 | 24 | |
| Genomic MicroRNA Methylation Polymorphism RNA Single nucleotide polymorphism |
3 28 – 5 – 27 |
0 19 – 1 – 4 |
Function often unclear; however, four biomarkers were involved in processes of coagulation, inflammation, and vascular tone. |
DCI = delayed cerebral ischemia; RNA = ribonucleic acid; SAH = subarachnoid hemorrhage.
The eight validated biomarkers of DCI are all related to known pathways of the multifactorial pathophysiology of DCI. In clinical DCI, increased platelet aggregability, thereby potentially leading to the formation of microthrombi, was observed by decreased admission levels of ADAMTS13 and increased levels of vWF on day 4 after SAH. As DCI usually occurs between days 4 and 10 after SAH (4), the early onset of significantly differing levels makes these biomarkers potentially predictive of DCI. Notwithstanding, the quality of the studies was rather low (NOS scores of 3/8 and 4/9), therefore a high-quality study is necessary to further elucidate matters.
Most inflammation and immune system biomarkers seem to be significantly elevated early in the course of SAH. Accordingly, elevated NLR (a validated biomarker) in the first couple of days following SAH was found to be significantly associated with clinical DCI in four independent studies. But, the exact predictive ability, including determination of an optimal cut-off value with accompanying accuracy, specificity, and sensitivity, remains to be determined. Whether NLR could also serve as a preventive treatment target is debatable, as NLR is a highly nonspecific biomarker and nonspecific anti-inflammatory therapies have thus far proven disappointing for the prevention of DCI (29). P-selectin was found to significantly increase during clinical DCI onset in two studies, which suggests that P-selectin may be a potential candidate for diagnosis or therapeutic treatment, for example, P-selectin antagonism. Thus far, therapies targeting P-selectin have only been performed in experimental settings of ischemic stroke, showing a reduction in infarct volume and better clinical outcome (30), and myocardial infarction, showing significantly reduced myocardial damage after percutaneous coronary intervention (31). P-selectin antagonism has not been studied in SAH, yet.
Three validated biomarkers of oxidative stress were found for clinical DCI in our review: F2-isoprostane in urine and genetic biomarkers haptoglobin polymorphism 2-1 and 2-2. Genetic markers often require extensive processing time and are therefore unsuitable for acute diagnosis; however, early determination of genetic profiles, for example, on admission, may aid in stratification of patients at high risk of clinical DCI. As such, the haptoglobin polymorphisms 2-1 and 2-2 may be useful for patient stratification, and could perhaps provide a potential preventive treatment target, for example, the administration of exogenous haptoglobulin (32). For F2-isoprostane, whether the observed increased urine levels have preceded the onset of clinical DCI in all patients is unknown; therefore, we cannot distinguish whether these biomarkers are predictive or diagnostic. Further research should be performed to explore the temporal relationship of these markers in regard to clinical DCI development.
The remaining validated biomarker, LPR in MD, allows for continuous neuromonitoring providing direct metabolic information, which can be used to detect an ischemic state, that is, radiological DCI. Since DCI currently is a clinical diagnosis per exclusion, LPR may be a helpful additive in comatose patients, as it may detect metabolic distress in an early phase already, before hypodensities are visible on noncontrast head CT and when ischemic brain injury may still be preventable. However, this invasive technique yields metabolic information only locally, resulting in a detection failure of at least 20% (27).
The difficulty of DCI is in the incomplete understanding of its pathophysiology and lack of hard diagnostic criteria. Currently, two definitions are used to identify patients with DCI: clinical and radiological DCI (4). Even though adherence to one definition yields a different selection of patients than the other, both are strongly related to poor clinical outcome at follow-up, therefore both seem to be relevant (33,34,35). Differences in the two definitions are clearly observed in this review, too, as 36 of 89 biomarkers studied for both definitions showed dissimilar results. The clinical definition seems to be the most relevant, given that early detection and correction of altered biomarkers may prevent the onset of clinical deficits. However, not all patients are neurologically assessable, therefore in comatose patients we currently rely on the radiological definition for DCI diagnosis. Considering that radiological appearance of ischemia or infarction is not immediately visible, once radiological DCI is diagnosed the treatment window for ischemic disease has often elapsed. Diagnosing radiological DCI based on biomarkers may lead to earlier detection of radiological DCI, perhaps even within the treatment window.
Limitations of this review are the heterogeneity in definitions used for DCI in literature, which complicates the inclusion of relevant studies, the methodological heterogeneity among included studies, which has resulted in a largely narrative review with a suboptimal method used for classification of biomarkers, and a high proportion of poor quality studies. The quality of studies was not implemented in our method used for classification. As a result, even though the results of studies of validated biomarkers have been reproduced by a second group, some of the selected validated markers rely on studies with relatively poor quality (e.g., ADAMTS13, vWF, and LPR). Strengths of this review are the strict use of the most up-to-date definition of DCI and the inclusion of all types of laboratory markers in blood as well as CSF.
Conclusion
In this review, seven biomarkers of clinical DCI (haptoglobin polymorphisms 2-1 and 2-2, ADAMTS13, NLR, P-selectin, and vWF in blood and F2-isoprostane in urine) and one biomarker of radiological DCI (LPR in MD) were selected as the most promising biomarkers of DCI. Future research should focus on determining the exact predictive or diagnostic abilities of these biomarkers, and exploring whether these biomarkers could serve as preventive or therapeutic treatment targets for DCI.
Disclosures
CRediT author statement: Maud A. Tjerkstra conceptualization, methodology, formal analysis, investigation, writing—original draft Homeyra Labib conceptualization, methodology, formal analysis, investigation, writing—review and editing Bert A. Coert writing—review and editing René Spijker conceptualization, methodology, writing—review and editing Jonathan M. Coutinho writing—review and editing Dagmar Verbaan conceptualization, methodology, writing—review and editing, supervision W. Peter Vandertop conceptualization, methodology, writing—review and editing, supervision.
Funding: This research did not receive any specific grant from funding agencies in the public, commercial, or not-for-profit sectors.
Conflicts of interest: The authors declare no conflicts of interest.
Data sharing: Access to review data may be granted upon request.
References
- 1. Dorhout Mees SM, Kerr RS, Rinkel GJ, Algra A, Molyneux AJ. Occurrence and impact of delayed cerebral ischemia after coiling and after clipping in the International Subarachnoid Aneurysm Trial (ISAT). J Neurol. 2012;259(4):679-683. CrossRef PubMed
- 2. Macdonald RL. Delayed neurological deterioration after subarachnoid haemorrhage. Nat Rev Neurol. 2014;10(1):44-58. CrossRef PubMed
- 3. Jabbarli R, Pierscianek D, Darkwah Oppong M, et al. Laboratory biomarkers of delayed cerebral ischemia after subarachnoid hemorrhage: a systematic review. Neurosurg Rev. 2018. 2020;43(3):825-833. CrossRef PubMed
- 4. Vergouwen MD, Vermeulen M, van Gijn J, et al. Definition of delayed cerebral ischemia after aneurysmal subarachnoid hemorrhage as an outcome event in clinical trials and observational studies: proposal of a multidisciplinary research group. Stroke. 2010;41(10):2391-2395. CrossRef PubMed
- 5. Petruk KC, West M, Mohr G, et al. Nimodipine treatment in poor-grade aneurysm patients. Results of a multicenter double-blind placebo-controlled trial. J Neurosurg. 1988;68(4):505-517. CrossRef PubMed
- 6. Pickard JD, Murray GD, Illingworth R, et al. Effect of oral nimodipine on cerebral infarction and outcome after subarachnoid haemorrhage: British aneurysm nimodipine trial. BMJ. 1989;298(6674):636-642. CrossRef PubMed
- 7. Budohoski KP, Guilfoyle M, Helmy A, et al. The pathophysiology and treatment of delayed cerebral ischaemia following subarachnoid haemorrhage. J Neurol Neurosurg Psychiatry. 2014;85(12):1343-1353. CrossRef PubMed
- 8. Kim BJ, Kim Y, Kim SE, Jeon JP. Study of correlation between Hp α1 expression of haptoglobin 2-1 and clinical course in aneurysmal subarachnoid hemorrhage. World Neurosurg. 2018;117:e221-e227. CrossRef PubMed
- 9. Leclerc JL, Blackburn S, Neal D, et al. Haptoglobin phenotype predicts the development of focal and global cerebral vasospasm and may influence outcomes after aneurysmal subarachnoid hemorrhage. Proc Natl Acad Sci USA. 2015;112(4):1155-1160. CrossRef PubMed
- 10. Ohnishi H, Iihara K, Kaku Y, et al. Haptoglobin phenotype predicts cerebral vasospasm and clinical deterioration after aneurysmal subarachnoid hemorrhage. J Stroke Cerebrovasc Dis. 2013;22(4):520-526. CrossRef PubMed
- 11. Li WH, Hui CJ, Ju H. Expression and significance of vWF, GMP-140 and ADAMTS13 in patients with aneurysmal subarachnoid hemorrhage. Eur Rev Med Pharmacol Sci. 2017;21(19):4350-4356. PubMed
- 12. Tang Q-F, Lu S-Q, Zhao Y-M, Qian J-X. The changes of von willebrand factor/a disintegrin-like and metalloprotease with thrombospondin type I repeats-13 balance in aneurysmal subarachnoid hemorrhage. Int J Clin Exp Med. 2015;8(1):1342-1348. PubMed
- 13. Liu H, Xu Q, Li A. Nomogram for predicting delayed cerebral ischemia after aneurysmal subarachnoid hemorrhage in the Chinese population. J Stroke Cerebrovasc Dis. 2020;29(9):105005. CrossRef PubMed
- 14. Al-Mufti F, Amuluru K, Damodara N, et al. Admission neutrophil-lymphocyte ratio predicts delayed cerebral ischemia following aneurysmal subarachnoid hemorrhage. J Neurointerv Surg. 2019;11(11):1135-1140. CrossRef PubMed
- 15. Tao C, Wang J, Hu X, Ma J, Li H, You C. Clinical value of neutrophil to lymphocyte and platelet to lymphocyte ratio after aneurysmal subarachnoid hemorrhage. Neurocrit Care. 2017;26(3):393-401. CrossRef PubMed
- 16. Wu Y, He Q, Wei Y, et al. The association of neutrophil-to-lymphocyte ratio and delayed cerebral ischemia in patients with aneurysmal subarachnoid hemorrhage: possible involvement of cerebral blood perfusion. Neuropsychiatr Dis Treat. 2019;15:1001-1007. CrossRef PubMed
- 17. Wang HC, Lin WC, Yang TM, et al. The association between symptomatic delayed cerebral infarction and serum adhesion molecules in aneurysmal subarachnoid hemorrhage. Neurosurgery. 2011;68(6):1611-1617. CrossRef PubMed
- 18. Frijns CJ, Fijnheer R, Algra A, van Mourik JA, van Gijn J, Rinkel GJ. Early circulating levels of endothelial cell activation markers in aneurysmal subarachnoid haemorrhage: associations with cerebral ischaemic events and outcome. J Neurol Neurosurg Psychiatry. 2006;77(1):77-83. CrossRef PubMed
- 19. Wiśniewski K, Popęda M, Tomasik B, et al. The role of urine F2-isoprostane concentration in delayed cerebral ischemia after aneurysmal subarachnoid haemorrhage—a poor prognostic factor. Diagnostics (Basel). 2020;11(1):22. CrossRef PubMed
- 20. Wiśniewski K, Bieńkowski M, Tomasik B, et al. Urinary F2-isoprostane concentration as a poor prognostic factor after subarachnoid hemorrhage. World Neurosurg. 2017;107:185-193. CrossRef PubMed
- 21. McGirt MJ, Blessing R, Nimjee SM, et al. Correlation of serum brain natriuretic peptide with hyponatremia and delayed ischemic neurological deficits after subarachnoid hemorrhage. Neurosurgery. 2004;54(6):1369-1373. CrossRef PubMed
- 22. Nakatsuka Y, Shiba M, Nishikawa H, et al; pSEED group. Acute-phase plasma osteopontin as an independent predictor for poor outcome after aneurysmal subarachnoid hemorrhage. Mol Neurobiol. 2018;55(8):6841-6849. CrossRef PubMed
- 23. Suzuki H, Nakatsuka Y, Yasuda R, et al. Dose-dependent inhibitory effects of cilostazol on delayed cerebral infarction after aneurysmal subarachnoid hemorrhage. Transl Stroke Res. 2018;10(4):381-388. CrossRef PubMed
- 24. Zhang X, Liu Y, Zhang S, Wang C, Zou C, Li A. Neutrophil-to-albumin ratio as a biomarker of delayed cerebral ischemia after aneurysmal subarachnoid hemorrhage. World Neurosurg. 2021;147:e453-e458. CrossRef PubMed
- 25. Starke RM, Kim GH, Komotar RJ, et al. Endothelial nitric oxide synthase gene single-nucleotide polymorphism predicts cerebral vasospasm after aneurysmal subarachnoid hemorrhage. J Cereb Blood Flow Metab. 2008;28(6):1204-1211. CrossRef PubMed
- 26. Kofler M, Gaasch M, Rass V, et al. The importance of probe location for the interpretation of cerebral microdialysis data in subarachnoid hemorrhage patients. Neurocrit Care. 2020;32(1):135-144. CrossRef PubMed
- 27. Torné R, Culebras D, Sanchez-Etayo G, et al. Double hemispheric microdialysis study in poor-grade SAH patients. Sci Rep. 2020;10(1):7466. CrossRef PubMed
- 28. Yang TM, Lin YJ, Tsai NW, et al. The prognostic value of serial leukocyte adhesion molecules in post-aneurysmal subarachnoid hemorrhage. Clin Chim Acta. 2012;413(3-4):411-416. CrossRef PubMed
- 29. Dodd WS, Laurent D, Dumont AS, et al. Pathophysiology of delayed cerebral ischemia after subarachnoid hemorrhage: a review. J Am Heart Assoc. 2021;10(15):e021845. CrossRef PubMed
- 30. Yilmaz G, Granger DN. Cell adhesion molecules and ischemic stroke. Neurol Res. 2008;30(8):783-793. CrossRef PubMed
- 31. Stähli BE, Gebhard C, Duchatelle V, et al. Effects of the P-selectin antagonist inclacumab on myocardial damage after percutaneous coronary intervention according to timing of infusion: insights from the SELECT-ACS trial. J Am Heart Assoc. 2016;5(11):e004255. CrossRef PubMed
- 32. Griffiths S, Clark J, Adamides AA, Ziogas J. The role of haptoglobin and hemopexin in the prevention of delayed cerebral ischaemia after aneurysmal subarachnoid haemorrhage: a review of current literature. Neurosurg Rev. 2020;43(5):1273-1288. CrossRef PubMed
- 33. Schmidt JM, Wartenberg KE, Fernandez A, et al. Frequency and clinical impact of asymptomatic cerebral infarction due to vasospasm after subarachnoid hemorrhage. J Neurosurg. 2008;109(6):1052-1059. CrossRef PubMed
- 34. Kreiter KT, Mayer SA, Howard G, et al. Sample size estimates for clinical trials of vasospasm in subarachnoid hemorrhage. Stroke. 2009;40(7):2362-2367. CrossRef PubMed
- 35. Frontera JA, Fernandez A, Schmidt JM, et al. Defining vasospasm after subarachnoid hemorrhage: what is the most clinically relevant definition? Stroke. 2009;40(6):1963-1968. CrossRef PubMed
- 36. Frijns CJ, Kasius KM, Algra A, Fijnheer R, Rinkel GJ. Endothelial cell activation markers and delayed cerebral ischaemia in patients with subarachnoid haemorrhage. J Neurol Neurosurg Psychiatry. 2006;77(7):863-867. CrossRef PubMed