|
J Circ Biomark 2023; 12: 34-43 ISSN 1849-4544 | DOI: 10.33393/jcb.2023.2480 ORIGINAL RESEARCH ARTICLE |
Impact of clinico-biochemical and inflammatory biomarkers on the immunogenicity and efficacy of SARS-CoV-2 adenoviral vaccine: a longitudinal study
ABSTRACT
Purpose: Due to a lack of effective antiviral treatment, several vaccines have been put forth to curb SARS-CoV-2 (severe acute respiratory syndrome coronavirus 2) infection and to reduce the mortality and morbidity rate by eliciting a protective immune response, primarily through virus-neutralizing antibodies specific for SARS-CoV-2 spike protein. This longitudinal study was designed to evaluate the vaccine effectiveness and immune response following the administration of adenoviral vaccine, COVISHIELD, in Indian population who were previously uninfected with SARS-CoV-2 and to reveal the effect of various sociodemographic, inflammatory and biochemical factors on antibody response.
Methods: Briefly, the total immunoglobulin G (IgG) against SARS-CoV-2 spike and nucleocapsid protein along with the immunological markers were estimated by chemiluminescent microparticle immunoassay (CMIA) technology. Biochemical parameters were estimated by spectrometry.
Results: A total of 348 subjects received two doses of COVISHIELD (224 males, 124 females). The mean age of the study subjects was 42.03 ± 13.54 years. Although both the doses of COVISHIELD against SARS-CoV-2 spike protein induced a robust immune response that lasted for months in all the subjects, the total IgG titer against SARS-CoV-2 spike protein was found significantly higher in subjects ≥50 years of age, and those with obesity, elevated triglycerides and elevated lactate dehydrogenase levels.
Conclusions: There is a definite effect of age and biochemical factors on the immunogenicity of COVISHIELD. An understanding of these factors could not only impact the design of vaccines and help improve vaccine immunogenicity and efficacy but also assist in decisions on vaccination schedules, in order to combat this deadly pandemic.
Keywords: COVID-19, CRP, IgG, LDH, SARS-CoV-2, Spike protein, Total antibodies, Vaccines
Received: August 3, 2023
Accepted: September 4, 2023
Published online: September 20, 2023
Journal of Circulating Biomarkers - ISSN 1849-4544 - www.aboutscience.eu/jcb
© 2023 The Authors. This article is published by AboutScience and licensed under Creative Commons Attribution-NonCommercial 4.0 International (CC BY-NC 4.0).
Commercial use is not permitted and is subject to Publisher’s permissions. Full information is available at www.aboutscience.eu
Introduction
Severe acute respiratory syndrome coronavirus 2 (SARS-CoV-2) has caused panic, with the World Health Organization (WHO) declaring it as a global health emergency on January 30, 2020 (1,2). Since the start of the pandemic, SARS-CoV-2 has affected more than 50,59,75,895 people, causing more than 62,03,293 deaths worldwide by March 2022 (3). As of April 20, 2022, the total number of cases in Jammu and Kashmir was 4,53,955 including 4,49,140 cures and 4,751 deaths (4). Total vaccine doses administered in the union territory of Jammu and Kashmir were 2,24,75,070 (5). Although several treatment strategies have been developed, vaccination is still the most important means to combat SARS-CoV-2 infection or to curb the coronavirus disease 2019 (COVID-19) pandemic (6).
The Indian national vaccination program started from January 16, 2021, after the approval of two candidate vaccines namely COVISHIELD (ChAdOx1-nCOV-19 or AZD1222, acquired from Oxford University and AstraZeneca, manufactured by Serum Institute of India, Pune—a chimpanzee adenovirus-vectored vaccine expressing the SARS-CoV-2 spike protein) and COVAXIN (BBV-152, manufactured by Bharat Biotech, Hyderabad, in collaboration with Indian Council of Medical Research—an inactivated whole-virus vaccine) (7,8). COVISHIELD is one of the most commonly used vaccines in India, eliciting the antibody response against SARS-CoV-2 spike protein. COVAXIN is yet to get WHO approval, thus the popularity of this vaccine among common Indian masses is relatively less.
All vaccines follow the same basic principle, pre-exposing the immune system of a person to either killed or weakened pathogens, or some of the pathogen’s structural parts, which leads the body to elicit an immune response (9). Similar to infection, vaccines result in early production of serum immunoglobulin (Ig)A, IgM and IgG antibodies, and also induce long-lasting memory B- and T-cell responses (10,11,12). Adenoviral vaccines are those in which viral gene delivery systems rely on a host viral genome (e.g., adenovirus) that typically lacks the genetic components necessary to produce new virions and that encodes antigenic components of the virus of interest to elicit a protective immune response, primarily through virus-neutralizing antibodies specific for spike protein of SARS-CoV-2. Such antibodies usually block the interaction of the virus with its cellular receptor or prevent conformational changes required for fusion of the virus with the host cell membrane and prevent the infection (13,14,15).
Although not very well established, various sociodemographic and clinico-biochemical factors affect the antibody production in response to vaccination. Male gender and higher age have been demonstrated to hamper SARS-CoV-2 vaccine immunogenicity (16). Similarly, different ethnic groups demonstrated varied antibody responses indicating a genetic influence on vaccine immunogenicity (17). In chronic obstructive pulmonary disease (COPD) and other lung infections, not only the initial response to pathogens and vaccines but also the strength with which the adaptive immune system responds to such challenges is impaired, leading to recurrent infections (18). Hypertension has been strongly associated with lower antibody titers in response to COVID-19 messenger ribonucleic acid (mRNA) vaccine (19). Hyperglycemia has been found to inhibit interleukin-6 (IL-6), thereby suppressing the antibody production (20). It was reported that obesity increased the likelihood of a poor vaccine-induced immune response (21). Obesity, dyslipidemia and excess adipose tissue could block the supply of nutrients to immune cells, leading to a constant low-grade inflammation thereby disrupting some immune responses, including those launched by T cells which can reduce the subsequent antibody production (22,23). Several studies showed that in severe SARS-CoV-2 infection, there is an increased serum level of inflammatory markers, such as C-reactive protein (CRP), lactate dehydrogenase (LDH), ferritin, D-dimer, and IL-6, all of which may result in cytokine storm (24) and lower levels of lymphocyte and platelets (25). IL-6 can reduce the production of fibronectin, albumin, and transferrin as well as the promotion of CD4+ T helper cells, which initiates the linking of innate and acquired immunity (26). Moreover, IL-6 is synthesized in the initial stages of inflammation and induces a number of acute-phase proteins, including CRP (27). High CRP has been shown to suppress T-cell function in autoimmune mouse models and to suppress dendritic cell (DC) function in normal people (28). More recent data suggest that hyperferritinemia may suppress immune responses by its ability to induce production of the anti-inflammatory cytokine IL-10 in lymphocytes (29).
Safety and immunogenicity are the major concerns regarding vaccines as their immunogenicity varies between individuals. Identifying the factors that affect the variability of antibody response to vaccines will not only contribute to studies on vaccines but also help to draft the strategies to combat this deadly pandemic as multiple variants of concern (VOCs) have the potential to jeopardize the effectiveness of vaccines. Overall no suitable study has been done till date that depicts the effect of various inflammatory and biochemical markers on antibody titer in response to vaccines against SARS-CoV-2 infection and vice versa. Therefore, the aim of this longitudinal study was to evaluate the vaccine effectiveness and immune response following the administration of COVISHIELD vaccine in Indian population who were previously uninfected with SARS-CoV-2 and to reveal the effect of various sociodemographic, inflammatory and biochemical factors that affect antibody response.
Materials and methods
Ethics statement
This study was performed in line with the principles of the Declaration of Helsinki. Ethical clearance for the study was sought from the Institutional Review Board, Government of Medical College Srinagar vide No. 1003/ETH/GMC. Informed consent both in vernacular as well as in English language was taken from the participants. Standard questionnaire or patient proforma was properly recorded and drafted as per sociodemographic and clinico-biochemical parameters. Vaccination data, including the name of the vaccine, number of doses received, dates, and place of administration, and clinical manifestations of COVID-19 were also recorded.
Study design
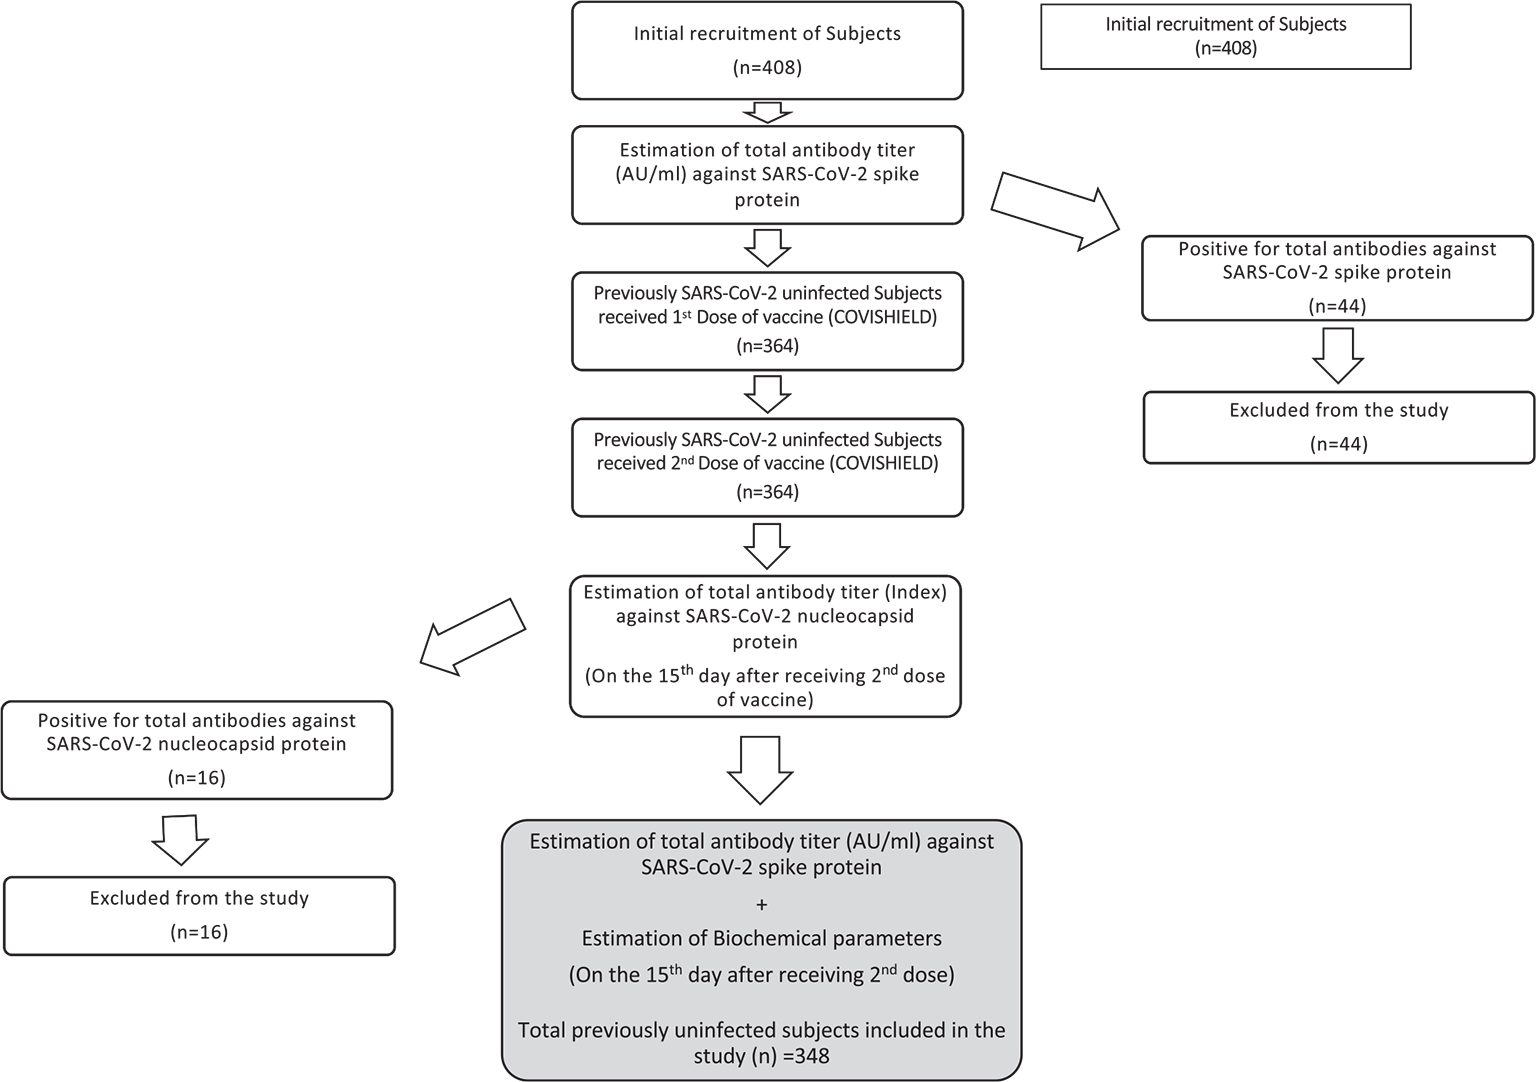
This was a longitudinal study undertaken in the Department of Biochemistry in collaboration with the Department of Social and Preventive Medicine, Government of Medical College Srinagar, from August 2021 to March 2022. Previously uninfected individuals receiving COVISHIELD vaccine were taken for the study. The study subjects were evaluated for various serum-based biomarkers at two different points of time. Figure 1 contains flow diagram depicting the elaborated study design.
Inclusion and exclusion criteria
All those individuals >18 years of age who received both doses of COVISHIELD and were not previously infected with SARS-COV-2 were included in the study. Individuals having any sort of genetic abnormality or malignancy were excluded from the study.
Study subjects and sample size
A total of 348 participants who were previously uninfected with SARS-CoV-2 were taken for the final study. We estimated previous seroprevalence from the available data to be 40%. We expected that about 10% of the recruited subjects may have been naturally infected before, during or after the vaccination. We calculated sample size on the basis of above criteria with 5% random error and 80% power of study using G power version 20.1.0. The sample size came out to be 369. Adding 10% of the subjects (which may fall under the naturally infected category) the total sample size calculated was 406 (369 + 37). Ultimately, a total of 408 subjects were recruited for the study.
Sample collection
Four milliliters of venous blood sample was obtained from each study subject before vaccination and on the 15th day after receiving the second dose of vaccine. Blood samples were collected in red top (clot activator) vials and thereafter centrifuged at 4,500 rpm for 2 min at normal temperature for separation of serum. Serum samples were immediately stored at −20°C till further analysis.
Quantitative estimation of total antibodies (IgG) against SARS-CoV-2 spike protein
Before vaccination, a total of 408 individuals underwent quantitative estimation of total IgG against SARS-CoV-2 spike protein to rule out any previous natural infection from SARS-CoV-2. Subsequently, all those individuals who were negative for IgG against SARS-CoV-2 nucleocapsid protein (n = 348) were taken for further estimation of total IgG against SARS-CoV-2 spike protein on the 15th day in response to the second dose of COVISHIELD. The estimation was done on Abbott ARCHITECT i2000SR fully automated immunoassay analyzer using SARS-COV-2 IgGII Quant Reagent Kit (Abbott, USA). This procedure uses chemiluminescent microparticle immunoassay (CMIA) technology for the estimation of antibodies. The positive levels of SARS-CoV-2 total IgG were taken as ≥50.0 AU/mL.
Semi-quantitative estimation (index) of total antibodies (IgG) against SARS-CoV-2 nucleocapsid protein
On the 15th day after receiving second dose of COVISHIELD, all the previously uninfected study subjects (n = 364) were taken for the estimation of antibodies (Index) against SARS-CoV-2 nucleocapsid protein to rule out any natural infection from SARS-CoV-2 after first or second dose of COVISHIELD. The estimation was done on Abbott ARCHITECT i2000SR fully automated immunoassay analyzer using SARS-CoV-2 IgG Reagent Kit (Abbott, USA). This procedure uses CMIA technology for the estimation of antibodies.
Determination of BMI
All the enrolled individuals (n = 348) underwent anthropometric assessment that included measurements of weight and height. Weight was measured without shoes using digital scales in an upright position and recorded to the nearest of 0.1 kg. Height was measured again without shoes in a standing position using a stadiometer to the nearest 0.1 cm. Body mass index (BMI) was calculated as per the formula: BMI (kg/m2) = Weight (kg)/Height (m2). BMI is an index of adiposity: individuals with BMI <18.5 kg/m2 were considered underweight; 18.5-24.99 kg/m2 as normal; 25-29.99 kg/m2 as preobese; 30-34.99 kg/m2 as obese class I and 35-39.99 kg/m2 as obese class II.
Quantitative estimation of biochemical parameters
All the previously uninfected individuals who received COVISHIELD (n = 348) underwent estimation of fasting blood glucose, total cholesterol (TC), triglycerides (TG), low-density lipoprotein cholesterol (LDL-C), high-density lipoprotein cholesterol (HDL-C) on the 15th day after receiving the second dose of vaccine. Glucose was estimated by hexokinase/glucose-6-phosphate dehydrogenase assay using Glucose Reagent Kit (Abbott, USA). TC was estimated by cholesterol esterase method using Cholesterol Reagent Kit (Abbott, USA). TGs were estimated enzymatically using Triglyceride Reagent Kit (Abbott, USA). LDL-C was estimated by liquid selective detergent using MULTIGENT Direct LDL Reagent Kit (Abbott, USA). HDL-C was estimated by accelerator selective detergent using Ultra HDL Reagent Kit (Abbott, USA). These biochemical parameters were estimated on Abbott ARCHITECT c4000SR fully automated clinical chemistry analyzer. The reference ranges of analytes were taken as: fasting blood glucose: 70-126 mg/dL; TC: 50-200 mg/dL; TG: 50-200 mg/dL; LDL: ≤120 mg/dL (normal); HDL: >40 mg/dL in males (normal), >45 mg/dL in females (normal).
Quantitative estimation of Thyroid-Stimulating Hormone
All the previously uninfected individuals who received COVISHIELD (n = 348) were taken for the estimation of thyroid-stimulating hormone (TSH) on the 15th day after receiving the second dose of vaccine. This parameter was estimated on Abbott ARCHITECT i2000SR fully automated immunoassay analyzer using TSH Reagent Kit and employing the technology of CMIA. The reference range of TSH was taken as 0.35-5.2 uIU/mL.
Quantitative estimation of ferritin and IL-6
All the previously uninfected individuals who received COVISHIELD (n = 348) were taken for the estimation of ferritin and IL-6 on the 15th day after receiving the second dose of vaccine. These parameters were estimated on Siemens ADVIA Centaur XP fully automated immunoassay analyzer using ADVIA Centaur FER Reagent Kit and ADVIA Centaur IL6 Reagent Kit (Siemens, USA) and employing the technology of CMIA. The reference range was taken as: ferritin: 22-274 ng/mL in males, 05-204 ng/mL in females; IL-6: 0-4.4 pg/mL.
Quantitative estimation of LDH and CRP
All the previously uninfected individuals who received COVISHIELD (n = 348) were taken for the estimation of LDH and CRP on the 15th day after receiving the second dose of vaccine. These parameters were estimated on Siemens Dimension RXL Max fully automated clinical chemistry analyzer using LDH Flex® reagent cartridge and RCRP Flex® reagent cartridge (Siemens, USA) and employing the technology of spectrophotometry. The reference range was taken as: LDH: 125-220 U/L; CRP: 0-0.35 mg/dL.
Statistical analysis
Descriptive statistics was used to represent levels in terms of means ± standard deviation (SD). The total antibody (IgG) titer was converted to log scale for linearization. Linear regression analysis was performed to assess the relationship between antibody response and various sociodemographic, clinico-biochemical and inflammatory markers. The data of various categorical variables were skewed, so Mann-Whitney U-test was performed as there are different participants in each group, with no participant being in more than one group. The distribution of scores for subgroups of the independent variables had different shape, so the Mann-Whitney U-test was actually used to compare mean ranks. Statistical analysis was performed using Statistical Package for the Social Sciences v. 23.0 statistical software.
Results
A total of 408 subjects were taken for quantitative estimation of total antibodies (IgG) against SARS-CoV-2 spike protein before receiving any dose of vaccine. Out of 408 subjects only 44 tested positive for total IgG against SARS-CoV-2 spike protein and were excluded from the study. Consequently, a total of 364 previously uninfected subjects received two doses of COVISHIELD 84 days apart. On the 15th day after receiving the second dose of vaccine, semi-quantitative estimation of antibodies against SARS-CoV-2 nucleocapsid protein was done in all 364 subjects. Out of 364 subjects, only 16 tested positive for total IgG against nucleocapsid protein and were excluded from the study. Hence, a total of 348 subjects who were previously uninfected with SARS-CoV-2 and received two doses of COVISHIELD were taken for the estimation of clinico-biochemical, inflammatory parameters and total antibodies (IgG) against SARS-CoV-2 spike protein.
Characteristics of study subjects
Table I contains sociodemographic and clinico-biochemical characteristics of previously uninfected individuals. The sociodemographic factors including age, gender and ethnicity were studied to find out the distribution of these factors in the subjects. In this study, subjects were categorized into two age groups: <50 and ≥50 years. Regarding the age, 67.8% (236 of 348) subjects fall in the age group of <50 years and 32.2% (112 of 348) were ≥50 years of age. With respect to gender, the ratio of males (224 of 348; 64.4%) was more than females (124 of 348; 35.6%). Regarding ethnicity, nonlocal residents were 83.9% (292 of 348) as compared to locals (56 of 348; 16.1%). Additionally, the clinico-biochemical parameters including history of lung disease, hypertension, type 2 diabetes mellitus (T2DM), TC, TG, LDL-C, HDL-C, TSH and anthropometric parameters including BMI were also determined on the 15th day after receiving the second dose of COVISHIELD. It was observed that 3.4% (12 of 348) subjects had a history of lung disease, 16.1% (56 of 348) had hypertension and 14.9% (52 of 348) had T2DM. With respect to BMI, 43.7% (152 of 348) were normal, 9.2% (32 of 348) were underweight, 33.3% (116 of 348) were preobese, 12.6% (44 of 348) were obese class I and 1.1% (04 of 348) were obese class II. As far as biochemical parameters are concerned, 23.8% (80 of 348) subjects had elevated cholesterol levels, 40.2% (140 of 348) had elevated TG levels, 34.5% (120 of 348) had elevated LDL-C levels, 58.6% (204 of 348) had low HDL-C levels, 24.1% (84 of 348) had elevated levels of TSH. Table II contains parameters of COVID test panel in study subjects. We observed that 24.1% (84 of 348) had elevated levels of LDH, 14.9% (52 of 348) had elevated levels of ferritin, 24.1% (84 of 348) had elevated levels of CRP and 32.2% (112 of 348) had elevated levels of IL-6 after receiving two doses of vaccine. Mean age of study subjects in years was 42.03 ± 13.54, mean BMI in kg/m2 was 24.8 ± 4.50, mean fasting blood sugar levels in mg/dL were 106.75 ± 48.35. Regarding the various inflammatory parameters, mean LDH levels in U/L were 189.93 ± 53.43, mean ferritin levels in ng/mL were 134.6 ± 115.09, mean CRP levels in mg/dL were 0.26 ± 0.33, mean IL-6 levels in pg/mL were 5.4 ± 9.01. In addition, mean total IgG titer was 8952.8 ± 9587.5 AU/mL and mean (log) total IgG was 8.60 ± 1.01 AU/mL. Table III portrays the levels (mean ± SD) of various biochemical and inflammatory parameters in the study subjects.
| Parameters | Study subjects
N = 348 (%) |
|---|---|
| Age group
<50 years ≥50 years |
236 (67.8) 112 (32.2) |
| Gender
Male Female |
224 (64.4) 124 (35.6) |
| Ethnicity
Nonlocal Local |
292 (83.9) 56 (16.1) |
| H/o lung disease
No Yes |
336 (96.6) 12 (3.4) |
| Hypertension
No Yes |
292 (83.9) 56 (16.1) |
| T2DM
No Yes |
296 (85.1) 52 (14.9) |
| BMI (kg/m2)
Normal Underweight Preobese Obese class I Obese class II |
152 (43.7) 32 (9.2) 116 (33.3) 44 (12.6) 04 (1.1) |
| Total cholesterol
Normal Elevated |
268 (77.0) 80 (23.8) |
| TG
Normal Elevated |
208 (59.8) 140 (40.2) |
| LDL-C
Normal Elevated |
228 (65.5) 120 (34.5) |
| HDL-C
Normal Low |
144 (41.4) 204 (58.6) |
| TSH
Normal Elevated |
264 (75.9) 84 (24.1) |
BMI = body mass index; HDL-C = high-density lipoprotein cholesterol; LDL-C = low-density lipoprotein cholesterol; SARS-CoV-2 = severe acute respiratory syndrome coronavirus 2; T2DM = type 2 diabetes mellitus; TG = triglycerides; TSH = thyroid-stimulating hormone.
| Parameters | Study subjects |
|---|---|
| LDH levels
Normal High |
264 (75.9) 84 (24.1) |
| Ferritin levels
Normal High |
296 (85.1) 52 (14.9) |
| CRP levels
Normal High |
264 (75.9) 84 (24.1) |
| IL-6 levels
Normal High |
236 (67.8) 112 (32.2) |
COVID-19 = coronavirus disease 2019; CRP = C-reactive protein; IL-6 = interleukin 6; LDH = lactate dehydrogenase.
| Parameters | Study subjects
Mean ± SD (Range) |
|---|---|
| Age (years) | 42.03 ± 13.54
(19.0-75.0) |
| BMI (kg/m2) | 24.8 ± 4.50
(16.4-34.1) |
| Fasting blood sugar (mg/dL) | 106.75 ± 48.35
(70.0-349.0) |
| Total cholesterol (mg/dL) | 172.10 ± 42.7
(84.0-317.0) |
| TG levels (mg/dL) | 192.06 ± 99.64
(55.0-172.0) |
| LDL-C levels (mg/dL) | 108.64 ± 36.12
(42.0-225.0) |
| HDL-C levels (mg/dL) | 41.94 ± 10.44
(23.0-88.0) |
| TSH levels (µIU/mL) | 4.34 ± 3.13
(0.3-21.5) |
| LDH levels (U/L) | 189.93 ± 53.43
(125.0-503.0) |
| Ferritin levels (ng/mL) | 134.6 ± 115.09
(3.6-554.1) |
| CRP levels (mg/dL) | 0.26 ± 0.33
(0.002-2.3) |
| IL-6 levels (pg/mL) | 5.4 ± 9.01
(0.0-57.1) |
| IgG (AU/mL) | 8952.8 ± 9587.5
(314.5-40000.0) |
| (Log) IgG | 8.60 ± 1.01
(5.7-10.6) |
BMI = body mass index; CRP = C-reactive protein; HDL-C = high-density lipoprotein cholesterol; IgG = immunoglobulin G; IL-6 = interleukin 6; LDH = lactate dehydrogenase; LDL-C = low-density lipoprotein cholesterol; SD = standard deviation; TG = triglycerides; TSH = thyroid-stimulating hormone.
Association of total IgG levels with sociodemographic; clinico-biochemical characteristics and parameters of COVID-19 test panel
Table IV depicts the association between total IgG antibody titer against SARS-CoV-2 spike protein (determined on the 15th day after receiving the second dose of COVISHIELD) and various sociodemographic and clinico-biochemical characteristics of the study subjects using linear regression. On regression analysis, we observed that locals had significantly more total IgG titer against SARS-CoV-2 compared to nonlocals ((Regression Coefficient) RC = 0.109, p = 0.04). Underweight subjects and individuals having class I obesity had significantly more antibody titer when compared to subjects with normal BMI (RC = 0.23, p = 0.006; RC = 0.29, p<0.0001). Those with elevated levels of TG had more IgG titer compared to those having normal TG levels (RC = 0.0180) and this association between TG levels and total IgG titer was statistically significant (p = 0.001). We did not find significant association of any other sociodemographic and clinico-biochemical parameter with the generation of total IgG against SARS-CoV-2 spike protein in response to vaccination.
Table V illustrates the association between total IgG antibody titer (determined on the 15th day after receiving the second dose of COVISHIELD) and various parameters of COVID-19 test panel in study subjects using linear regression. We observed that subjects having high LDH levels produced significantly higher total IgG antibodies compared to those having normal LDH levels, and this association was statistically significant (RC = 0.15, p = 0.006). Subjects having normal levels of CRP had significantly higher antibody titer when compared to those having high CRP levels (−00122, p = 0.023).
| Parameters | Study group
N = 348 (%) |
Regression coefficient
(Beta) |
95% CI | p-Value |
|---|---|---|---|---|
| Age group
<50 years ≥50 years |
236 (67.8) 112 (32.2) |
0.078 |
(−0.06-0.4) |
0.15 |
| Gender
Male Female |
224 (64.4) 124 (35.6) |
0.029 |
(−0.16-0.28) |
0.59 |
| Ethnicity
Nonlocal Local |
292 (83.9) 56 (16.1) |
0.109 |
(0.01-0.59) |
0.04 |
| H/o lung disease
No Yes |
336 (96.6) 12 (3.4) |
−0.10 |
(−1.11-0.05) |
0.07 |
| Hypertension
No Yes |
292 (83.9) 56 (16.1) |
−0.07 |
(−0.30-0.27) |
0.92 |
| T2DM
No Yes |
296 (85.1) 52 (14.9) |
−0.04 |
(−0.49-0.19) |
0.47 |
| BMI (kg/m2)
Normal Underweight Preobese Obese class I Obese class II |
152 (43.7) 32 (9.2) 116 (33.3) 44 (12.6) 04 (1.1) |
0.23 0.11 0.29 −0.09 |
(0.15-0.9) (−0.007-0.23) (0.12-0.33) (−0.36-0.09) |
0.006 0.06 <0.0001 0.2 |
| Total cholesterol
Normal Elevated |
268 (77.0) 80 (23.8) |
−0.05 |
(−0.37-0.14) |
0.37 |
| TG
Normal Elevated |
208 (59.8) 140 (40.2) |
0.180 |
(0.16-0.59) |
0.001 |
| LDL-C
Normal Elevated |
228 (65.5) 120 (34.5) |
−0.073 |
(−0.38-0.07) |
0.17 |
| HDL-C
Normal Low |
144 (41.4) 204 (58.6) |
0.014 |
(−0.19-0.25) |
0.79 |
| TSH
Normal Elevated |
264 (75.9) 84 (24.1) |
−0.005 |
(−0.26-0.23) |
0.92 |
BMI = body mass index; CI = confidence interval; HDL-C = high-density lipoprotein cholesterol; IgG = immunoglobulin G; LDL-C = low-density lipoprotein cholesterol; T2DM = type 2 diabetes mellitus; TG = triglycerides; TSH = thyroid-stimulating hormone.
Bold represents statistically significant association.
As the frequency was skewed among subgroups of various independent variables, Mann-Whitney U-test was performed. Table VI depicts the association between total IgG antibody titer against SARS-CoV-2 spike protein and various sociodemographic and clinico-biochemical characteristics of study subjects using Mann-Whitney U-test. The results were identical to the results of linear regression with some notable differences. Surprisingly, subjects ≥50 years of age developed significantly more antibodies against SARS-CoV-2 spike proteins (U = 11368.00, p = 0.035). On performing Mann-Whitney U-test, there was no statistically significant difference in total IgG titer against SARS-CoV-2 between locals and nonlocals (p = 0.083). Differently, preobese subjects but not underweight individuals were having significantly more antibody titer when compared to subjects having normal BMI (U = 7440, p = 0.029).
| Parameters | Study group
N = 348 (%) |
Regression coefficient
(Beta) |
95% CI | p-Value |
|---|---|---|---|---|
| LDH levels
Normal High |
264 (75.9) 84 (24.1) |
0.15 |
(0.1-0.6) |
0.006 |
| Ferritin levels
Normal High |
296 (85.1) 52 (14.9) |
0.09 |
(−0.05-0.5) |
0.096 |
| CRP levels
Normal High |
264 (75.9) 84 (24.1) |
−0.122 |
(−0.54-0.04) |
0.023 |
| IL-6 levels
Normal High |
236 (67.8) 112 (32.2) |
0.055 |
(−0.10-0.35) |
0.302 |
CI = confidence interval; COVID-19 = coronavirus disease 2019; CRP = C-reactive protein; IgG = immunoglobulin G; IL-6 = interleukin-6; LDH = lactate dehydrogenase.
Bold represents statistically significant P value of <0.05.
| Parameters | Study group
N = 348 (%) |
Mean rank | U value | p-Value |
|---|---|---|---|---|
| Age group
<50 years ≥50 years |
236 (67.8) 112 (32.2) |
166.67 191.00 |
11368.00 |
0.035 |
| Gender
Male Female |
224 (64.4) 124 (35.6) |
171.13 180.60 |
13132.00 |
0.4 |
| Ethnicity
Nonlocal Local |
292 (83.9) 56 (16.1) |
170.40 195.86 |
6980.00 |
0.083 |
| H/o lung disease
No Yes |
336 (96.6) 12 (3.4) |
174.79 166.50 |
1920.00 |
0.77 |
| Hypertension
No Yes |
292 (83.9) 56 (16.1) |
172.84 183.14 |
7692.00 |
0.48 |
| T2DM
No Yes |
296 (85.1) 52 (14.9) |
174.38 175.19 |
7660.00 |
0.95 |
| BMI (kg/m2)
Normal Underweight |
152 (43.7) 32 (9.2) |
88.97 109.25 |
1896.00 |
0.50 |
| Normal
Preobese |
152 (43.7)
116 (33.3) |
125.45
146.36 |
7440.00 | 0.029 |
| Normal
Obese class I |
152 (43.7)
44 (12.6) |
89.97
127.95 |
2048.00 | <0.001 |
| Normal
Obese class II |
152 (43.7)
04 (1.1) |
79.13
54.50 |
208.00 | 0.28 |
| Total cholesterol
Normal Elevated |
268 (77.0) 80 (23.8) |
177.60 164.10 |
9888.0 |
0.29 |
| TG
Normal Elevated |
208 (59.8) 140 (40.2) |
162.23 192.73 |
12008.00 |
0.006 |
| LDL-C
Normal Elevated |
228 (65.5) 120 (34.5) |
181.01 162.13 |
12196.00 |
0.096 |
| HDL-C
Normal Low |
144 (41.4) 204 (58.6) |
172.86 175.66 |
14452.00 |
0.79 |
| TSH
Normal Elevated |
264 (75.9) 84 (24.1) |
175.95 169.93 |
10704.00 |
0.63 |
BMI = body mass index; HDL-C = high-density lipoprotein cholesterol; IgG = immunoglobulin G; LDL-C = low-density lipoprotein cholesterol; T2DM = type 2 diabetes mellitus; TG = triglycerides; TSH = thyroid-stimulating hormone.
*Test was adopted as the distribution of scores for both groups of few independent variables was skewed.
Bold represents statistically significant P value of <0.05.
Table VII illustrates association between total IgG antibody titer and various parameters of COVID-19 test panel in study subjects using Mann-Whitney U-test. In contrast to the results of linear regression, we did not observe any statistical significance between total IgG antibody titer and CRP levels (p = 0.33).
Discussion
In this study based on 348 vaccinated participants, we showed variation in anti-spike total antibody (IgG) titer based on various sociodemographic and clinico-biochemical parameters. To the best of our knowledge, our study is the first to compare a short-term assessment of antibody response to vaccination with low-grade inflammation.
| Parameters | Study group
N = 348 (%) |
Mean rank | U value | p-Value |
|---|---|---|---|---|
| LDH levels
Normal High |
264 (75.9) 84 (24.1) |
165.92 201.45 |
8824.00 |
0.005 |
| Ferritin levels
Normal High |
296 (85.1) 52 (14.9) |
170.64 196.50 |
6552.00 |
0.87 |
| CRP levels
Normal High |
264 (75.9) 84 (24.1) |
177.44 165.26 |
10312.00 |
0.33 |
| IL-6 levels
Normal High |
236 (67.8) 112 (32.2) |
170.86 182.18 |
12356.00 |
0.32 |
COVID-19 = coronavirus disease 2019; CRP = C-reactive protein; IgG = immunoglobulin G; IL-6 = interleukin 6; LDH = lactate dehydrogenase.
*Test was adopted as the distribution of scores for both groups of few independent variables was skewed.
Bold represents statistically significant P value of <0.05.
A negative correlation between age and antibody titer in response to different vaccinations such as hepatitis B, seasonal influenza, tetanus and pneumococcal vaccine is well known (30,31). “Immunosenescence” combined with “Inflammaging” are the factors responsible for poor antibody production after vaccination in elderly individuals (32). Contrary to majority of findings, our study observed a significant upsurge of antibodies against SARS-CoV-2 spike protein in subjects ≥50 years of age. Although with age adaptive immunity diminishes, but to associate immunosenescence with the sequential process of aging can be deceptive. As per varied studies individuals of the same chronological age can have a widely variable “immunological age” (33,34). Interestingly, even if the loss of antibody production in the elderly has been noticed by various studies no age-related differences in the avidity and functional activity of antibodies induced by vaccination has been brought to the fore by major studies (35,36).
Sociodemographic factors such as race and ethnicity are known to influence susceptibility to infectious diseases and have recently been shown to be associated with immune response variations and adverse events following vaccination (37,38). Although not statistically significant, we observed generation of slightly higher total IgG in locals (Kashmiri individuals) than nonlocals after vaccination. The difference in the antibody response might be due to the fact that Kashmiri population is ethnic due to peculiar traditional and religious beliefs than the rest of the country due to which their genetic pool remains conserved and it is known that genetic determinants play an important role in regulating immune responses after infection or vaccination (39,40).
In our study, preobese and obese class I subjects produced significantly more antibodies after vaccination compared to subjects having normal BMI. There is a lot of evidence seconding the raised antibody titer in response to SARS-CoV-2 vaccination in obese individuals. Obesity is connected with substantial modification and profusion of immune cells in the adipose tissues with a noticeable decrease in Th2 cells, Treg cells, and M-2 macrophages (41,42). Adipose tissue of the obese subject expresses increased amounts of proinflammatory proteins such as tumor necrosis factor alpha (TNF-α), IL-6, transforming growth factor-beta 1 (TGF-β1), CRP, and monocyte chemotactic protein-1 (MCP-1) compared to adipose tissue of lean subjects, which subsequently upsurges immune response and antibody production (43,44). Obese and swollen adipose tissue encompasses >40% M-1 macrophages, which act as spring for a range of proinflammatory cytokines leading to a local as well as systemic inflammation that triggers immune cell activation (45). Callahan et al testified that obese adults had significantly higher antibody titer than adults with normal weight after first dose of vaccine (46). Studies have upheld that among obese subjects, the initial antibody response to H1N1 vaccine was robust (47).
In our study, it was also observed that individuals having high TG levels produced significantly more antibodies after vaccination. Numerous studies have shown that patients with isolated hypertriglyceridemia had augmented CRP and IL-6 concentration (48), thereby increasing CD4+ T helper cells and antibody production (49). Our observation was also supported by previous reports linking enhanced expression of B cells with dyslipidemia (50). Xu et al described that T and B lymphocytes were having markedly increased expression in patients with dyslipidemia compared to healthy controls (51). During lipolysis, TG release free fatty acids (FFA) in the presence of lipoprotein lipase (LPL), thereby inducing endothelial proinflammatory changes, tissue inflammation and vigorous immune response (52).
In this study, we also observed that those having high levels of LDH produced significantly increased IgG against SARS-CoV-2 after vaccination. LDH is a general indicator of acute or chronic tissue damage and is considered to be an inflammatory marker and predictor of increased immune response (53). During lung damage and other interstitial lung infections, LDH levels get increased (54). Therefore, more the concentration of natural infectious agent or artificial antigen, more is the inflammation and LDH level, hence more is the antibody response. Conventional or myeloid DCs are highly specialized antigen-presenting cells with a unique ability to prime naive T cells inducing the activation of the adaptive immune response (55). Increased lactate from infection and tissue injury due to increased LDH leads to extracellular acidosis, which in turn activates DCs inducing the activation of the adaptive immune response (56).
Limitation of the study
The data of subgroups of various independent variables are slightly skewed, which could affect the outcome of the study. Data skewness has been taken care of by converting antibody levels to log scale and applying Mann-Whitney U-test. The sample size of the study is relatively modest and further large-scale studies are needed to consolidate the inferences made in our study.
Conclusion
This study summarized that age, BMI, TG and LDH levels strongly influence immunogenicity of adenoviral vaccine against SARS-CoV-2. Our study gives an opportunity to understand the impact of biochemical and immunological factors affecting vaccine effectiveness. Therefore, our inferences could be utilized in designing vaccine studies and could help in designing personalized vaccination schedules that would ultimately lead to improvement in vaccine response and efficacy, especially at times of pandemics. In future, this study will assist to identify individuals at risk for low immunogenicity to adenoviral vaccines against SARS-CoV-2 and to subsequently intervene upon these risk factors.
Disclosures
Financial support: The study was funded by Government Medical College Srinagar, Karan Nagar, Srinagar, J&K, India, vide GMC/2021/17.
Conflict of interest: The authors disclose that there are no financial or nonfinancial interests that are directly or indirectly related to the work submitted for publication.
Consent for publication: The authors affirm that human research participants provided informed consent for publication of their details.
Data availability statement: The data presented in this study are available on request from the corresponding author. The data are not publicly available due to strict institutional policies.
Authors’ contributions: Conceptualization: MSK, SM; Data curation: MSK, SM; Formal analysis: MSK, IH, NN; Funding acquisition: SM, SMSK; Investigation: JAB, MSK, NN; Methodology: MSK, SM; Project administration: SM; Resources: SM, SMSK; Software: MSK, IH; Supervision: SM; Validation: MSK, SM, NN, JAB, IH, SMSK; Visualization: MSK, SM, NN, JAB, IH, SMSK; Writing—original draft: MSK, NN; Writing—review and editing: MSK; Approval of final manuscript: all authors.
References
- 1. Majid S, Khan MS, Rashid S, et al. COVID-19: diagnostics, therapeutic advances, and vaccine development. Curr Clin Microbiol Rep. 2021;8(3):152-166. CrossRef PubMed
- 2. Farooq R, Majid S, Hanif A, Qureshi W. Current insights into the coronavirus: genomics of 2019-nCoV. Clin Med Case Rep. 2020;3:03-1.
- 3. COVID-19 Dashboard by the Center for Systems Science and Engineering (CSSE) at Johns Hopkins University (JHU). Online. Accessed April 20, 2022.
- 4. COVID19 Statewise Status. Online. Accessed April 20, 2022.
- 5. COVID-19 Vaccination Update. Ministry of Health and Family Welfare: Government of India. Online. Accessed April 20, 2022.
- 6. Majid S, Farooq R, Khan MS, et al. Managing the COVID-19 pandemic: research strategies based on the evolutionary and molecular characteristics of coronaviruses. SN Compr Clin Med. 2020;2(10):1767-1776. CrossRef PubMed
- 7. Voysey M, Clemens SAC, Madhi SA, et al; Oxford COVID Vaccine Trial Group. Safety and efficacy of the ChAdOx1 nCoV-19 vaccine (AZD1222) against SARS-CoV-2: an interim analysis of four randomised controlled trials in Brazil, South Africa, and the UK. Lancet. 2021;397(10269):99-111. CrossRef PubMed
- 8. Bharat Biotech Announces Phase 3 Results of COVAXIN®: India’s First COVID-19 Vaccine Demonstrates Interim Clinical Efficacy of 81%. Online. Accessed April 20, 2022.
- 9. Klausegger A, Strobl B, Regl G, Kaser A, Luytjes W, Vlasak R. Identification of a coronavirus hemagglutinin-esterase with a substrate specificity different from those of influenza C virus and bovine coronavirus. J Virol. 1999;73(5):3737-3743. CrossRef PubMed
- 10. Wang Z, Schmidt F, Weisblum Y, et al. mRNA vaccine-elicited antibodies to SARS-CoV-2 and circulating variants. Nature. 2021;592(7855):616-622. CrossRef PubMed
- 11. Khan SMS, Qurieshi MA, Haq I, et al. Seroprevalence of SARS-CoV-2-specific IgG antibodies in Kashmir, India, 7 months after the first reported local COVID-19 case: results of a population-based seroprevalence survey from October to November 2020. BMJ Open. 2021;11(9):e053791. CrossRef PubMed
- 12. Haq I, Qurieshi MA, Khan MS, et al. The burden of SARS-CoV-2 among healthcare workers across 16 hospitals of Kashmir, India—a seroepidemiological study. PLoS One. 2021 Nov 19;16(11):e0259893. CrossRef PubMed
- 13. Chen H, Xiang ZQ, Li Y, et al. Adenovirus-based vaccines: comparison of vectors from three species of adenoviridae. J Virol. 2010;84(20):10522-10532. CrossRef PubMed
- 14. Wall EC, Wu M, Harvey R, et al. Neutralising antibody activity against SARS-CoV-2 VOCs B.1.617.2 and B.1.351 by BNT162b2 vaccination. Lancet. 2021;397(10292):2331-2333. CrossRef PubMed
- 15. Wang P, Nair MS, Liu L, et al. Antibody resistance of SARS-CoV-2 variants B.1.351 and B.1.1.7. Nature. 2021;593(7857):130-135. CrossRef PubMed
- 16. Pellini R, Venuti A, Pimpinelli F, et al. Initial observations on age, gender, BMI and hypertension in antibody responses to SARS-CoV-2 BNT162b2 vaccine. EClinicalMedicine. 2021;36:100928. CrossRef PubMed
- 17. Zimmermann P, Curtis N. Factors that influence the immune response to vaccination. Clin Microbiol Rev. 2019;32(2):e00084-e00118. CrossRef PubMed
- 18. Brusselle GG, Joos GF, Bracke KR. New insights into the immunology of chronic obstructive pulmonary disease. Lancet. 2011;378(9795):1015-1026. CrossRef PubMed
- 19. Drummond GR, Vinh A, Guzik TJ, Sobey CG. Immune mechanisms of hypertension. Nat Rev Immunol. 2019;19(8):517-532. CrossRef PubMed
- 20. Berbudi A, Rahmadika N, Tjahjadi AI, Ruslami R. Type 2 diabetes and its impact on the immune system. Curr Diabetes Rev. 2020;16(5):442-449. CrossRef PubMed
- 21. Painter SD, Ovsyannikova IG, Poland GA. The weight of obesity on the human immune response to vaccination. Vaccine. 2015;33(36):4422-4429. CrossRef PubMed
- 22. Vandanmagsar B, Youm YH, Ravussin A, et al. The NLRP3 inflammasome instigates obesity-induced inflammation and insulin resistance. Nat Med. 2011;17(2):179-188. CrossRef PubMed
- 23. Milner JJ, Beck MA. The impact of obesity on the immune response to infection. Proc Nutr Soc. 2012;71(2):298-306. CrossRef PubMed
- 24. Pedersen SF, Ho YC. SARS-CoV-2: a storm is raging. J Clin Invest. 2020;130(5):2202-2205. CrossRef PubMed
- 25. Kermali M, Khalsa RK, Pillai K, Ismail Z, Harky A. The role of biomarkers in diagnosis of COVID-19—a systematic review. Life Sci. 2020;254:117788. CrossRef PubMed
- 26. Tanaka T, Kishimoto T. The biology and medical implications of interleukin-6. Cancer Immunol Res. 2014;2(4):288-294. CrossRef PubMed
- 27. Szalai AJ, van Ginkel FW, Dalrymple SA, Murray R, McGhee JR, Volanakis JE. Testosterone and IL-6 requirements for human C-reactive protein gene expression in transgenic mice. J Immunol. 1998;160(11):5294-5299. CrossRef PubMed
- 28. Zhang L, Liu SH, Wright TT, et al. C-reactive protein directly suppresses Th1 cell differentiation and alleviates experimental autoimmune encephalomyelitis. J Immunol. 2015;194(11):5243-5252. CrossRef PubMed
- 29. Gray CP, Franco AV, Arosio P, Hersey P. Immunosuppressive effects of melanoma-derived heavy-chain ferritin are dependent on stimulation of IL-10 production. Int J Cancer. 2001;92(6):843-850. CrossRef PubMed
- 30. Naaber P, Tserel L, Kangro K, et al. Dynamics of antibody response to BNT162b2 vaccine after six months: a longitudinal prospective study. Lancet Reg Health Eur. 2021;10:100208. CrossRef PubMed
- 31. Collier DA, Ferreira IATM, Kotagiri P, et al; CITIID-NIHR BioResource COVID-19 Collaboration. Age-related immune response heterogeneity to SARS-CoV-2 vaccine BNT162b2. Nature. 2021;596(7872):417-422. CrossRef PubMed
- 32. Ciabattini A, Nardini C, Santoro F, Garagnani P, Franceschi C, Medaglini D. Vaccination in the elderly: the challenge of immune changes with aging. Semin Immunol. 2018;40:83-94. CrossRef PubMed
- 33. Alpert A, Pickman Y, Leipold M, et al. A clinically meaningful metric of immune age derived from high-dimensional longitudinal monitoring. Nat Med. 2019;25(3):487-495. CrossRef PubMed
- 34. Bartleson JM, Radenkovic D, Covarrubias AJ, Furman D, Winer DA, Verdin E. SARS-CoV-2, COVID-19 and the aging immune system. Nat Aging. 2021;1(9):769-782. CrossRef PubMed
- 35. Weisberg SP, Connors TJ, Zhu Y, et al. Distinct antibody responses to SARS-CoV-2 in children and adults across the COVID-19 clinical spectrum. Nat Immunol. 2021;22(1):25-31. CrossRef PubMed
- 36. Stiasny K, Aberle JH, Keller M, Grubeck-Loebenstein B, Heinz FX. Age affects quantity but not quality of antibody responses after vaccination with an inactivated flavivirus vaccine against tick-borne encephalitis. PLoS One. 2012;7(3):e34145. CrossRef PubMed
- 37. McQuillan GM, Kruszon-Moran D, Hyde TB, Forghani B, Bellini W, Dayan GH. Seroprevalence of measles antibody in the US population, 1999-2004. J Infect Dis. 2007;196(10):1459-1464. CrossRef PubMed
- 38. Christy C, Pichichero ME, Reed GF, et al. Effect of gender, race, and parental education on immunogenicity and reported reactogenicity of acellular and whole-cell pertussis vaccines. Pediatrics. 1995;96(3 Pt 2):584-587. CrossRef PubMed
- 39. Stein CM, Guwatudde D, Nakakeeto M, et al. Heritability analysis of cytokines as intermediate phenotypes of tuberculosis. J Infect Dis. 2003;187(11):1679-1685. CrossRef PubMed
- 40. Brodin P, Davis MM. Human immune system variation. Nat Rev Immunol. 2017;17(1):21-29. CrossRef PubMed
- 41. Serena C, Keiran N, Ceperuelo-Mallafre V, et al. Obesity and type 2 diabetes alters the immune properties of human adipose derived stem cells. Stem Cells. 2016;34(10):2559-2573. CrossRef PubMed
- 42. Mraz M, Haluzik M. The role of adipose tissue immune cells in obesity and low-grade inflammation. J Endocrinol. 2014;222(3):R113-R127. CrossRef PubMed
- 43. Hotamisligil GS, Shargill NS, Spiegelman BM. Adipose expression of tumor necrosis factor-alpha: direct role in obesity-linked insulin resistance. Science. 1993;259(5091):87-91. CrossRef PubMed
- 44. Fried SK, Bunkin DA, Greenberg AS. Omental and subcutaneous adipose tissues of obese subjects release interleukin-6: depot difference and regulation by glucocorticoid. J Clin Endocrinol Metab. 1998;83(3):847-850. CrossRef PubMed
- 45. Liu R, Nikolajczyk BS. Tissue immune cells fuel obesity-associated inflammation in adipose tissue and beyond. Front Immunol. 2019;10:1587. CrossRef PubMed
- 46. Callahan ST, Wolff M, Hill HR, et al; NIAID Vaccine and Treatment Evaluation Unit (VTEU) Pandemic H1N1 Vaccine Study Group. Impact of body mass index on immunogenicity of pandemic H1N1 vaccine in children and adults. J Infect Dis. 2014;210(8):1270-1274. CrossRef PubMed
- 47. Sheridan PA, Paich HA, Handy J, et al. Obesity is associated with impaired immune response to influenza vaccination in humans. Int J Obes. 2012;36(8):1072-1077. CrossRef PubMed
- 48. Lundman P, Eriksson MJ, Silveira A, et al. Relation of hypertriglyceridemia to plasma concentrations of biochemical markers of inflammation and endothelial activation (C-reactive protein, interleukin-6, soluble adhesion molecules, von Willebrand factor, and endothelin-1). Am J Cardiol. 2003;91(9):1128-1131. CrossRef PubMed
- 49. Heinrich PC, Castell JV, Andus T. Interleukin-6 and the acute phase response. Biochem J. 1990;265(3):621-636. CrossRef PubMed
- 50. Ma SD, Mussbacher M, Galkina EV. Functional role of B cells in atherosclerosis. Cells. 2021;10(2):270. CrossRef PubMed
- 51. Xu DM, Li Q, Yi JX, et al. Investigation of lymphocyte subsets in peripheral blood of patients with dyslipidemia. Int J Gen Med. 2021;14:5573-5579. CrossRef PubMed
- 52. Wang L, Sapuri-Butti AR, Aung HH, Parikh AN, Rutledge JC. Triglyceride-rich lipoprotein lipolysis increases aggregation of endothelial cell membrane microdomains and produces reactive oxygen species. Am J Physiol Heart Circ Physiol. 2008;295(1):H237-H244. CrossRef PubMed
- 53. Sepulveda J. Challenges in routine clinical chemistry analysis: proteins and enzymes. In: Dasgupta A, Sepulveda JL, eds. Accurate results in the clinical laboratory. Elsevier 2013: 131-148. Online
- 54. McFadden RG, Oliphant LD. Serum lactate dehydrogenase in interstitial lung disease. Chest. 1991;100(4):1182. CrossRef PubMed
- 55. Banchereau J, Steinman RM. Dendritic cells and the control of immunity. Nature. 1998;392(6673):245-252. CrossRef PubMed
- 56. Sallusto F, Lanzavecchia A. Efficient presentation of soluble antigen by cultured human dendritic cells is maintained by granulocyte/macrophage colony-stimulating factor plus interleukin 4 and downregulated by tumor necrosis factor alpha. J Exp Med. 1994;179(4):1109-1118. CrossRef PubMed