|
J Circ Biomark 2022; 11: 5-13 ISSN 1849-4544 | DOI: 10.33393/jcb.2022.2317 ORIGINAL RESEARCH ARTICLE |
MicroRNAs from urinary exosomes as alternative biomarkers in the differentiation of benign and malignant prostate diseases
ABSTRACT
Introduction: Prostate cancer (PCa) is the second most frequently diagnosed cancer and the fifth most cancer-related cause of death worldwide. Various tools are used in the diagnosis of PCa, such as the Prostate-Specific Antigen (PSA) value or digital rectal examination. A final differentiation from benign prostate diseases such as benign prostatic hyperplasia (BPH) can often only be made by a transrectal prostate biopsy. This procedure carries post-procedural complications for the patients and may lead to hospitalization.
Urinary exosomes contain unique components, such as microRNAs (miRNAs) with information about their original tissue. As miRNAs appear to play a role in the development of PCa, they might be useful to develop procedures that could potentially make transrectal biopsies avoidable in certain situations.
Methods: The current study aimed to investigate whether miRNAs from urinary exosomes can be used to differentiate PCa from BPH. For this purpose, urine samples from 28 patients with PCa and 25 patients with BPH were collected and analysed using next-generation sequencing to obtain expression profiles.
Results and conclusion: The two miRNAs hsa-miR-532-3p and hsa-miR-6749-5p showed a significant differential expression within the group of patients with PCa in a training subset of the data containing 32 patients. They were further validated on the independent test data subset containing 20 patients. Additionally, a machine learning algorithm was used to generate a miRNA pattern to distinguish the two disease entities. Both approaches seem to be suitable for the search of alternative diagnostic tools for the differentiation of benign and malignant prostate diseases.
Keywords: Biomarker, Extracellular vesicles, Liquid biopsy, microRNA, Prostate cancer, Urine
Received: July 31, 2021
Accepted: January 12, 2022
Published online: February 10, 2022
Journal of Circulating Biomarkers - ISSN 1849-4544 - www.aboutscience.eu/jcb
© 2022 The Authors. This article is published by AboutScience and licensed under Creative Commons Attribution-NonCommercial 4.0 International (CC BY-NC 4.0).
Commercial use is not permitted and is subject to Publisher’s permissions. Full information is available at www.aboutscience.eu
Introduction
The prostate is an accessory gland, located below the bladder. It consists of three different zones that are clinically and histologically relevant: the peripheral zone makes up the largest part, the central zone surrounds the ejaculatory ducts and the transition zone encircles the urethra (1).
With increasing age, the prostate grows, causing an enlargement of the transition zone, which can lead to a benign prostatic hyperplasia (BPH) and obstruction (BPO). About 50% to 75% of men among the age of 50, and more than 80% of men over 70 years of age are affected by BPO (2,3). The symptoms caused by this vary and may also resemble those of prostate cancer (PCa), such as incomplete bladder emptying, a decreased urinary stream, nocturia or infections of the urinary tract. However, prognosis and outcome differ substantially.
PCa is the second-most diagnosed cancer in the world. Among cancer-related death in men, it is the fifth leading cause with a mortality of 7.6 per 100,000 worldwide (4,5).
The distinction between the two entities is made using different diagnostic parameters. A digital rectal examination and the determination of the PSA value are carried out as screening tools. In case of suspicion, further procedures such as multiparametric magnetic resonance imaging (MRI) and targeted and systematic biopsy are indicated (6). So far, the diagnostic gold standard is transrectal or transperineal biopsy that carries a certain risk of post-procedural complications (7), leading to an ongoing need for other non-invasively available and effective diagnostic tools (8).
MicroRNAs (miRNAs) from urinary exosomes might have the potential to serve as early biomarkers. Accordingly, this study investigates its use to differentiate patients with BPH and those with PCa.
Exosomes are extracellular vesicles (EVs) secreted by almost all cell types. They can be isolated from urine, an easily and non-invasively available body fluid. EVs are produced in the endosomal system and actively secreted. As they contain different molecular components, such as proteins, mRNAs and miRNAs of their respective origin cell (9,10), several studies propose their potential as biomarkers in early stages of disease (11).
MiRNAs are single-stranded, non-coding RNA molecules consisting of ~22 nucleotides. More than 60% of human protein-coding genes are targeted by miRNAs (12). Thus, miRNAs are implicated in a variety of biological processes including cell differentiation, development, proliferation, stress response and apoptosis (13). Various studies investigated the connection between miRNA expression profiles and certain types of cancer. An association between chronic lymphatic leukaemia and miRNA deregulation was shown for the first time in 2007 (14). The stability of miRNAs from solid tumour tissues was proven in serum and plasma samples (15), as well as miRNAs in urine and urinary exosomes (16), supporting their potential to serve as ideal biomarker. Recently, the high potential of small RNAs from urine to distinguish benign and malignant prostate diseases was shown (17).
It should be emphasized that this study compares the miRNA expression patterns of two cohorts of diseased patients who may suffer from similar symptoms (BPO or PCa). Since the differentiation of BPH from PCa represents a certain difficulty in clinical practice, it can often only be definitively determined with a transrectal biopsy. The vision is to establish a biomarker from a potentially easily available source, such as urine, as an alternative diagnostic to avoid the invasive transrectal biopsy.
Materials and methods
Ethical approval
The study was approved by the ethics committee of the University of Witten/Herdecke in 3/2014 (application number: 07/2014). It was planned as a monocentric, comparative study. A following ethics application to investigate the same patient data and samples with an alternative method was approved in 2018.
Sample collection
The recruitment of 85 patients was realized from 03/2014 until 02/2015 at the Helios University Hospital Wuppertal, Department of Urology. Included were patients who underwent prostate biopsy due to elevated PSA levels or who were admitted for surgical BPO treatment (holmium laser enucleation of the prostate).
For this study, a subset of PCa samples (n = 28) and BPH samples (n = 25) was analysed. The number of samples was limited by the amount of urine available, at least 8 mL, as 4 mL was used for each assay run. A previous sample size determination was not performed due to lack of comparative data with respect to the method used here.
Exclusion criteria were infectious diseases (HIV, hepatitis, tuberculosis), received antiandrogen therapy (due to potential effects on the PCa), radiotherapy of the little pelvis and the inability to agree to give informed consent to participate in this study.
Isolation of RNA from urinary exosomes
Urinary exosomes were isolated using the Norgen Urine Exosome RNA Isolation Kit (#47200, Norgen Biotek Corporation). While the kit allows the isolation of exosomal RNA from 1 to 10 mL urine samples, 4 mL starting volume was used in this study. The isolation was performed as specified in the related protocol (Norgen Biotek Corporation, 2018). The exosomal miRNA input for the library preparation was measured using the Qubit Fluorimeter 3.0 (Invitrogen Life Technologies Corp.) and the microRNA Assay Kit (#Q32881, Thermo Fisher Scientific).
Library preparation and next-generation sequencing
Library preparation was performed using the QIAseq miRNA Library Kit (cat no: 331505, Qiagen) following the QIAseq miRNA Library Kit Handbook (Qiagen, 2018). Implemented was a prolonged three-ligation step to 18 hours, due to previous experiments.
The kit operates with unique molecular identifiers (UMIs), unique sequences that are integrated into the reverse transcription. Consequently, each miRNA is assigned to a unique sequence, enabling the exact quantification of input miRNA by next-generation sequencing (NGS). This approach reduces the usual amplification bias during polymerase chain reaction.
Quality and quantity control of the libraries was conducted using an automated electrophoresis (Agilent 2100 Bioanalyzer, DNA 1000 Kit), following the corresponding protocol (Agilent Technologies, 2016). NGS was carried out using an illumina sequencing platform (NextSeq 500) with a single read length of 75 bp and around 400 million reads per run.
Statistical and bioinformatic analysis
For raw data analysis the sequencing files were uploaded to the GeneGlobe Data Analysis Center and processed using the QIAseq miRNA Primary Quantification software (Qiagen, 2018).
A downstream analysis was performed using R 3.5.3 (18) and RStudio 1.2.1335 and R-scripts created by the de.NBI service centre BioInfra.Prot (19). The data table was read and imported with R package openxlsx 4.1.0.1 (20). Two steps of filtering were conducted for cleaning of the relevant data. From the R package caret 6.0-84 (21) the nearZeroVar function was used, removing 100 miRNAs due to their low variance and therefore no ability to separate the groups. Additionally, miRNAs with more than three zero counts in each group were removed, 115 miRNAs remained. Normalization and statistical testing was performed using the R package DESeq2 1.22.2 (22). Considering multiple testing and a potentially increased type I error rate, an adjusted p-value was calculated using the Benjamini-Hochberg procedure.
One sample was removed due to an insufficient variance resulting from a large proportion of zero counts. The 52 remaining samples were randomly divided into a training set (PCa = 17 samples, BPH = 15 samples) and a test set (PCa and BPH = 10 samples each) to validate the results.
Graphics such as the volcano plot and Principal Component Analysis (PCA) were created with R package ggplot2 3.1.1 (23) and aligned with cowplot 0.9.4 (24); the volcano plots were labelled with ggrepel 0.8.1 (25). The performance of potential biomarker candidates to discriminate the two groups was additionally visualized with the help of receiver operating characteristic (ROC) curve, conducted with R package pROC 1.15.0 (26).
Data analysis to find a miRNA panel was carried out using a previously published machine learning algorithm (17). Briefly, on the training dataset a random forest (27) model with 100,000 trees was trained using the R-package randomForest (28) to acquire a random forest-specific variable importance measure (mean decrease of the Gini index). For panel sizes m between 1 and 50, the m variables with the highest variable importance in the model were chosen as a panel. For each of these 50 sets of variables, the random forest was retrained on the training dataset. To evaluate all 50 specific models (one for each panel size m) the samples of test dataset were classified. ROC curves were drawn and the panel with the best area under the curve (AUC) was chosen from the 50 sets of variables. For comparison, an additional ROC curve was drawn to show the performance of the chosen panel on the training dataset (by splitting it 1,000 times randomly into a training and test subset with the ratio 2:1). In a heat map (z-scored values) the miRNAs from the chosen panel were visualized with dendrograms from hierarchical clustering.
Results
Demographic and clinicopathological characteristics
A detailed list of demographic and clinicopathological characteristics of the participants is displayed (Tab. I). The two cohorts of patients with PCa and BPH demonstrate a nearly even distribution, regarding patient age, PSA level, fPSA level and PSA ratio. Within the patient cohort with BPH, the increased prostate volume measured via transrectal ultrasound (TRUS) and the bacterial positive urinary status could be attributed to the urethral obstruction, the leading symptom of the underlying disease. In summary, two highly matching and therefore comparable patient cohorts were evaluated in this study.
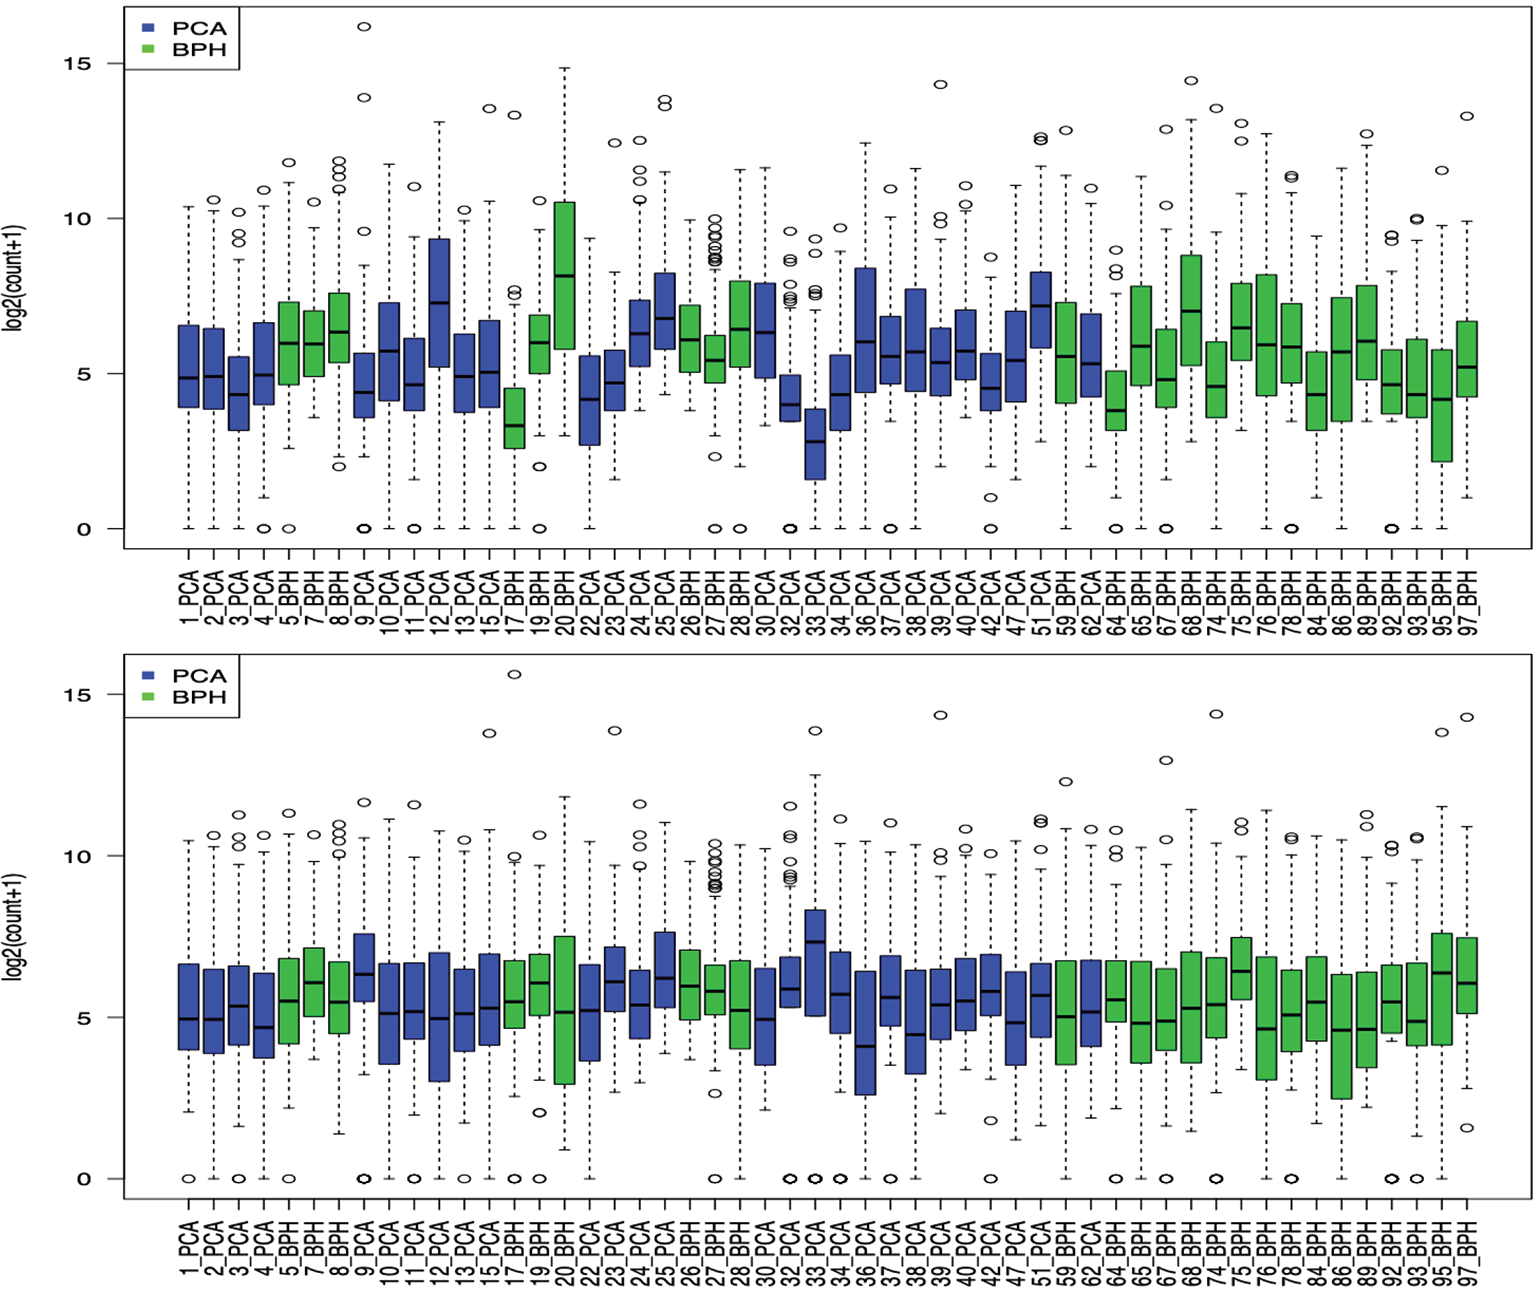
Normalization
The dataset was normalized as described above, resulting in an apparently higher comparable dataset for further analysis (Fig. 1).
Comparison of expression profiles
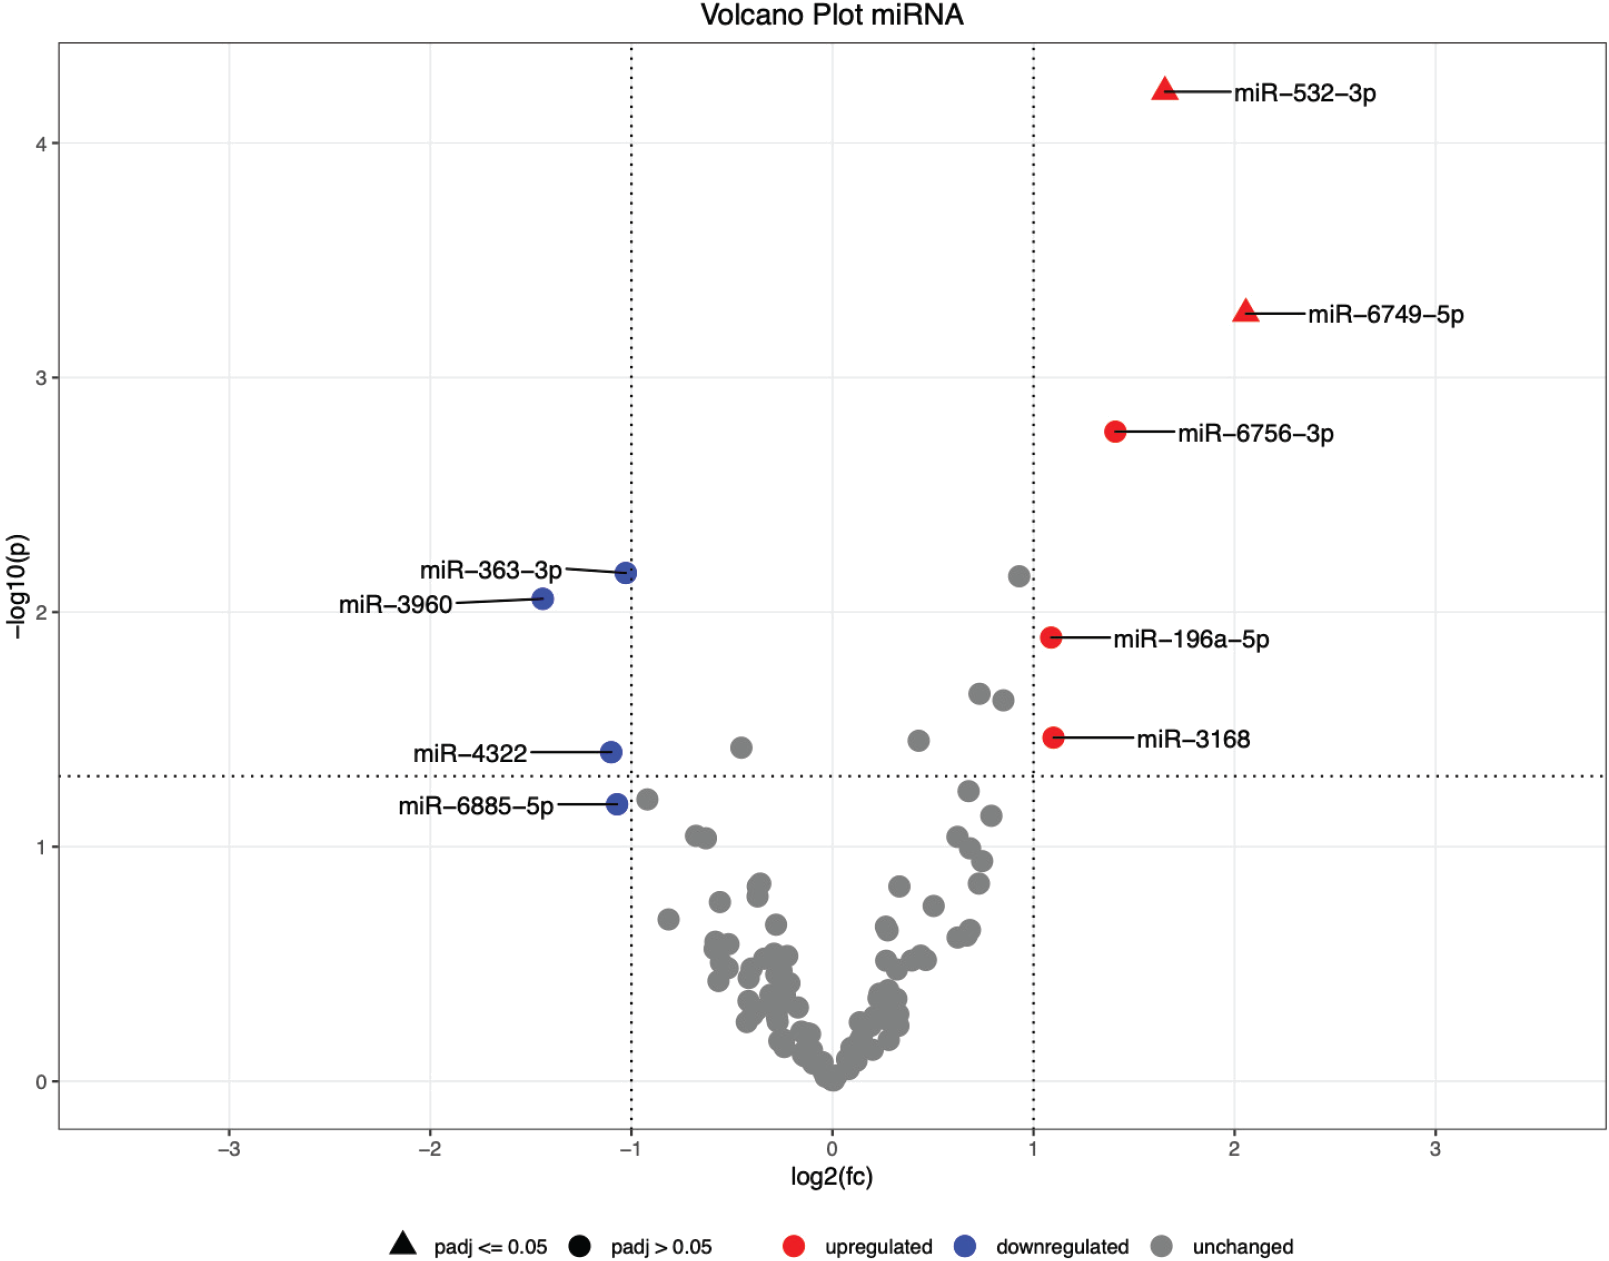
The statistical analysis resulted in two miRNAs with a significant overexpression within the group of PCa samples. Both have a high log2-fold-change (>1.65), displaying their differential expression compared to other biomarker candidates (Tab. II).
| Characteristics | Patients with BPH | Patients with PCa |
|---|---|---|
| Number (n) | 25 | 27 |
| Age in years (median) | 68 | 70 |
| PSA in ng/mL (median) | 6.89 | 8.34 |
| fPSA in ng/mL (median) | 1.43 | 1.095 |
| PSA ratio (median) | 0.18 | 0.165 |
| Prostate volume in mL (median) | 50 | 38.5 |
| Urinary status: bacterial positive | 48% (n = 12) | 14.8% (n = 4) |
| miRNA | Log2-Fold-Change | p-value | adjusted p-value | AUC (Test Dataset) |
|---|---|---|---|---|
| hsa-miR-6749-5p | 2.05598389 | 0.00053395 | 0.03070213 | 0.678 |
| hsa-miR-532-3p | 1.6532989 | 6.0461E-05 | 0.00695299 | 0.644 |
| hsa-miR-6756-3p | 1.40729735 | 0.00169959 | 0.06515094 | 0.544 |
| hsa-miR-3960 | −1.4405426 | 0.00877074 | 0.16810583 | 0.589 |
| hsa-miR-363-3p | −1.0276721 | 0.00680747 | 0.16167405 | 0.7 |
Adjusted p-values <0.05 are marked in bold, corresponding to a significance niveau of 5%. Area under the curve (AUC) values were calculated on the test dataset, shown in the last column. Subsequent over- and under-expressed miRNAs are also displayed (complete data are available at the following data repository: Online)
Compared to the group of BPH, five miRNAs are upregulated with a log2-fold-change >1 among the PCa group, while two of them meet the criterion for the adjusted p-value (<0.05). The results of the analysis are visualized in a volcano plot (Fig. 2).
Due to its upregulation with a log2-fold-change of ~1.65 in urinary exosomes in patients with PCa, hsa-miR-532-3p is considered as a novel biomarker in the differentiation of PCa and BPH.
According to miRNA database (miRBase), hsa-mir-532-3p was found in 139 experiments (29). The exact understanding of its biological function in cancer genesis is an ongoing research process, in which hsa-mir-532-3p is mainly described as a putative tumour supressing miRNA. For example, it directly regulates the expression of the water channel protein aquaporin 9 (AQP9), which is significantly associated with poor prognosis in renal cell carcinoma (30). A decreased level of intracellular hsa-miR-523-3p is associated with metastatic progression in hepatocellular cancer, due to its direct regulation of the oncogenic kinesin family member C1 (KIFC1) (31). Moreover, a decreased level of intracellular hsa-miR-532-3p in colorectal cancer promotes cell growth and metastasis. It directly regulates E26 oncogene homolog 1 (ETS1) and transglutaminase 2 (TGM2), which are associated with cell proliferation via the Wnt/β-catenin pathway. Interestingly, it also shows potential as an in vitro chemotherapy sensitizer in colorectal cancer (32). In non-small cell lung cancer, hsa-miR-532-3p regulates the forkhead box P3 (FOXP3) and thereby inhibits proliferation and metastasis (33). It must be noted that in terms of cancer research, the understanding of one dysregulated miRNA affecting a specific target mRNA is limited until further understanding of other miRNAs affecting the same mRNA is available (34).
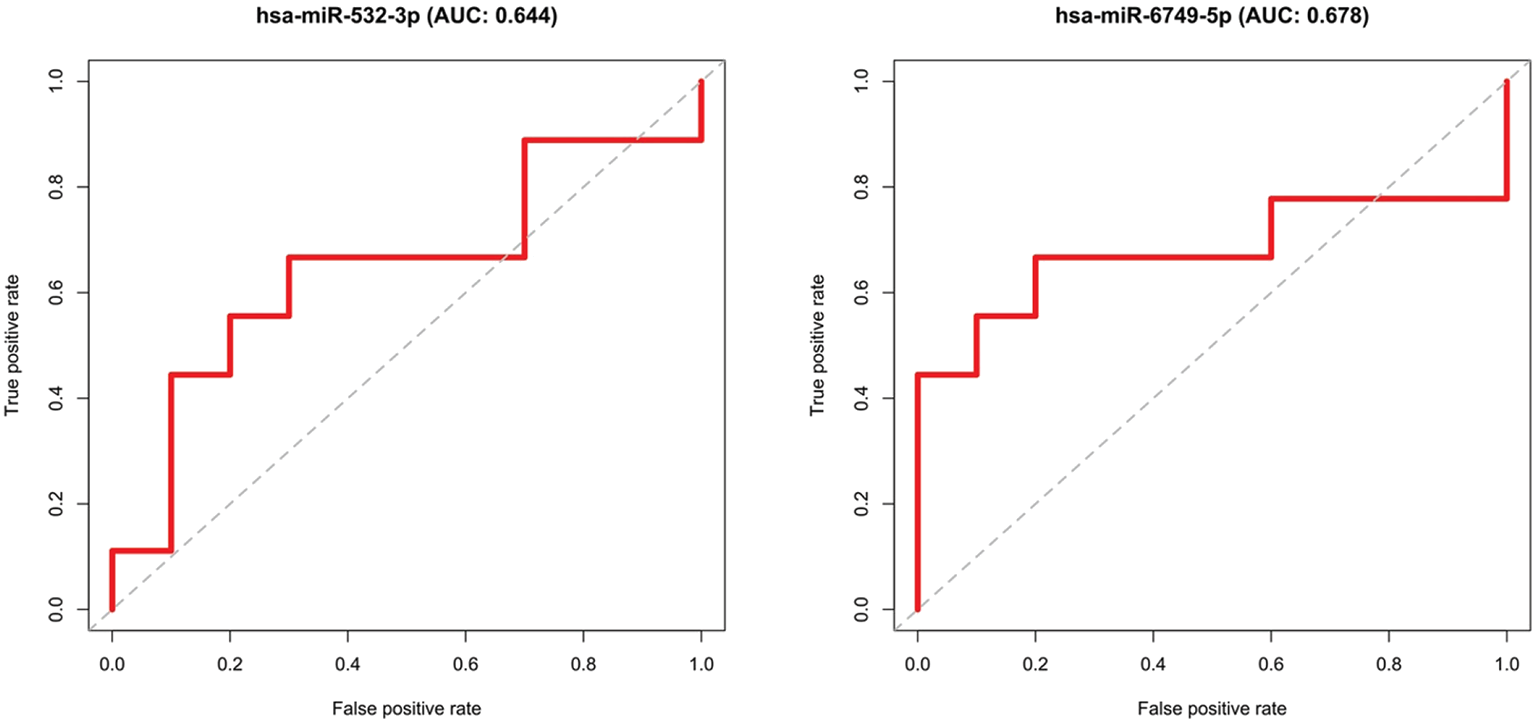
A rather new potential biomarker is hsa-miR-6749-5p. It was found in 16 experiments (29), for instance, it was differently expressed in serum of patients with breast cancer (35). Moreover, it was significantly upregulated in serum of patients with nasopharyngeal cancer (36). In the current study, hsa-miR-6749-5p was significantly upregulated with a log2-fold-change of ~2.0 within the group of patients with PCa. The validation on the test set shows a diagnostic test accuracy of 80% specificity and 66.7% sensitivity. Among the compared data, hsa-miR-6749-5p has the highest fold change and therefore might be an interesting new biomarker in the differentiation of PCa and BPH.
Both miRNAs, especially hsa-miR-532-3p, seem to play a role in the genesis of different types of cancer. It should be considered that the present study only found a correlation of two upregulated miRNAs in urinary exosomes in patients with PCa. Conclusions about the causality of this upregulation cannot be drawn as the dysregulated miRNAs can either be the cause or the effect of cancer development. As shown in two further studies, hsa-mir-532 is presented once upregulated and once downregulated as a potential biomarker. In serum of patients with breast cancer, it was significantly upregulated as a part of the miR-532-502 cluster (37), whereas it was found significantly downregulated in urine supernatant of patients with bladder cancer (38).
Considering the found candidates, it is not known if those are prostate-specific miRNAs, as the prostate gland can be grouped with salivary glands, seminal vesicles and the lactating breast, regarding their miRNA expression profiles (39) and no prostate-specific miRNAs are described so far. However, further experiments need to proof their reliability and enhance the understanding of its biological function, such as target genes and signalling pathways in the human body.
Validation
The two significant differentially expressed miRNAs (hsa-miR-6749-5p, hsa-miR-532-3p) were validated, using the remaining 10 samples of each group (BPH/PCa), which were not used for the selection (i.e. the test set). Specificity and sensitivity were determined and visualized in ROC curves (Fig. 3). The calculated AUCs show that the miRNAs do not reach the set limit of 0.7, thereby the two groups cannot be finally distinguished.
Panel calculation
The panel calculation resulted in a panel of eight miRNAs:
| hsa-miR- | hsa-miR- | hsa-miR- | hsa-miR-4322 | 4532 | 532-3p | 1307-3p | ||||||
| hsa-miR- | hsa-miR- | hsa-miR- | hsa-miR-3656 | 196a-5p | 6749-5p | 92a-3p |
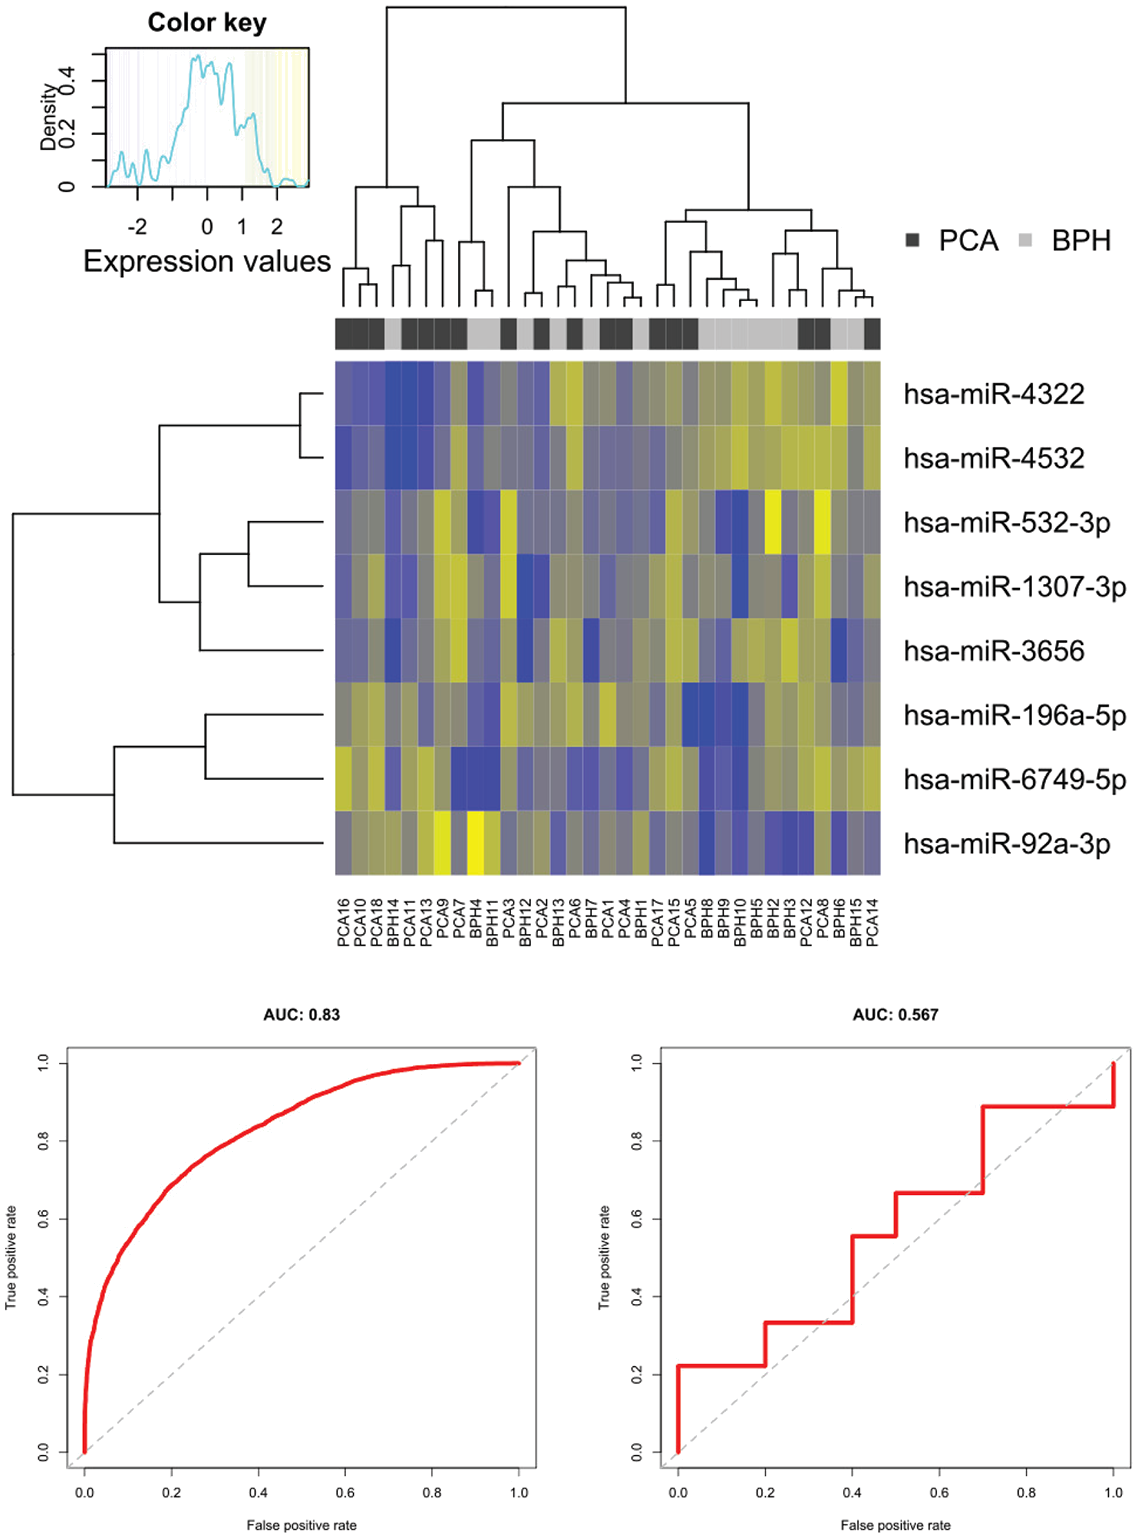
In the heat map (Fig. 4), the hierarchical clustering based on these eight miRNAs is shown via the dendrograms. Besides, the blocks in black and grey visualize the two patient cohorts. The expression profiles of the miRNAs are graphically represented through different colour intensities. A clear separation of the two groups cannot be concluded, yet three clusters can be identified, of which the leftmost cluster contains only PCa except for one outlier. The middle cluster is split in half between PCa and BPH and the one on the right has a slight tendency towards BPH. A tendency of lower expression values is remarkable in the upper left corner (PCa). In contrast, the upper right corner (BPH) displays higher expression values.
Using a machine learning algorithm is an alternative approach to find a stable diagnostic tool for the differentiation of patients with PCa and those with BPH. Single miRNAs can be variously affected, either in cancer genesis or through other cellular processes. As shown above, some miRNAs are dysregulated, but not over all patients in the same extent. The found panel consists of eight miRNAs, combines highly dysregulated miRNAs (fold change >1.5) with those that were not prominent in the search for single biomarkers. There seem to be certain ranges of values that can be grouped into clusters. From this, it could be suggested that a patient falling within the left value range is very likely to have a diagnosis of PCa. If a patient is categorized in the middle or right cluster a statement cannot be made with certainty and the currently performed diagnostics should be carried out.
The detected panel of eight miRNAs was further validated on the training and test dataset and visualized in ROC curves (Fig. 4). On the training dataset, the AUC of >0.8 indicates a high distinguishing potential. A decline of the AUC based on the test dataset was expectable, although a clear distinction of the patient cohorts cannot be stated in this case (AUC < 0.7). A reason might be the relatively small sample size in this study.
Nonetheless, the use of miRNA panels is a promising approach, as it is not as susceptible to interference as an individual biomarker, whose expression depends on various factors.
Limitations
We are aware that this study is limited by the currently still high costs for high-throughput processes. The sample selection was influenced by the availability of the required amount of urine volume and the quality of the samples collected, as the protein concentration or the presence of blood cells may also affect the concentration of small RNAs (40). Due to the number of samples, a correlation between clinicopathological parameters such as the Gleason score and individual miRNAs could not be determined. The comparability with other studies is also limited due to a lack of standardized protocols and quality standards. The results of this study for both the search for single biomarkers and the miRNA panel certainly depend on the underlying data quality, especially the UMI read count. Furthermore, we tried to consider the conditions in everyday clinical practice and therefore used a low possible initial urine volume. A higher starting volume might have led to an increased output of small RNA reads.
Conclusion
PCa is a serious disease with far-reaching consequences for the patient, whereas BPH is a benign disease that affects a large proportion of the male population at an advanced age. Further diagnostic tools are needed to improve the current differentiation standards, since the PSA is not cancer specific and may be elevated in BPH and other non-malignant conditions of the prostate as well (6).
The possibility of using miRNAs from urinary exosomes to differentiate benign and malignant prostate diseases is demonstrated in this study. In particular, two promising biomarker candidates for the diagnosis of PCa have been identified. Since their exact molecular effects are not known yet, their biological function should be investigated in follow-up studies for a better understanding. The results of this work should also be validated and confirmed in, at best, multicentre study cohorts with a larger sample size. The search for biomarker panels using a machine learning algorithm is a promising and robust approach by which previously overlooked miRNAs might increase the assay accuracy when additional data from a larger study will be available. To date, the transrectal biopsy remains the gold standard in the diagnosis of PCa. However, if the current development of high-throughput methods continues in terms of efficiency and cost-effectiveness, we believe that a non-invasive urine test based on miRNAs from urinary exosomes is a promising future option.
Acknowledgements
Many thanks to Fatemeh Gholamrezaei for teaching all the laboratory practical skills and supervising us, also to Prof. Dr. Florian Kreppel and colleagues for the intellectual support and exchange within the journal club. For the helpful and friendly provision of their equipment in the laboratory in Wuppertal, we would also like to thank Prof. Dr. Jan Postberg and Dr. Patrick Weil. For the financial support, we would like to thank the Paul-Kuth foundation.
Data availability
Supporting data are available online at https://www.ebi.ac.uk/biostudies/studies/S-BSST683
Disclosures
Conflict of interest: The authors declare no conflict of interest.
Financial support: The work of KS and MT was supported by de.NBI (FKZ 031 A 534A), a project of the German Federal Ministry of Education and Research (BMBF). The funding of ME relates to PURE and VALIBIO, projects of Northrhine-Westphalia.
LM, JH and AS were supported by the Paul-Kuth-Foundation, Wuppertal, Germany.
SD, NMD and SR were supported by the Helios Kliniken GmbH, Berlin, Germany (Grant ID 000030).
Author contributions statement: AS was the principal investigator. AS, MK and CK provided the original concept for the research questions and the study design. CK was responsible for the study protocol and ethics approval. JH and LM were responsible for the laboratory implementation of the study. SD, NMD and SR enrolled all patients in this study and collected the urine samples and the clinical data. KS and MT were responsible for the statistical planning and bioinformatic analysis of the data. They also generated the tables and figures. JH and LM wrote the first draft of the article and AS, MK, CK, and KS, MT, reviewed later versions of the article. ME reviewed the last draft of the article. JH and LM contributed equally.
References
- 1. McNeal JE. Normal histology of the prostate. Am J Surg Pathol. 1988;12(8):619-633. CrossRef PubMed
- 2. Garraway WM, Collins GN, Lee RJ. High prevalence of benign prostatic hypertrophy in the community. Lancet. 1991;338(8765):469-471. CrossRef PubMed
- 3. Egan KB. The epidemiology of benign prostatic hyperplasia associated with lower urinary tract symptoms: prevalence and incident rates. Urol Clin North Am. 2016;43(3):289-297. CrossRef PubMed
- 4. Sung H, Ferlay J, Siegel RL, et al. Global cancer statistics 2020: GLOBOCAN estimates of incidence and mortality worldwide for 36 cancers in 185 countries. CA Cancer J Clin. 2021;71(3):209-249. CrossRef PubMed
- 5. Jemal A, Bray F, Center MM, Ferlay J, Ward E, Forman D. Global cancer statistics. CA Cancer J Clin. 2011;61(2):69-90. CrossRef PubMed
- 6. European Association of Urology Guidelines. 2020 Edition. Arnhem, The Netherlands: European Association of Urology Guidelines Office; 2020. Online
- 7. Loeb S, Vellekoop A, Ahmed HU, et al. Systematic review of complications of prostate biopsy. Eur Urol. 2013;64(6):876-892. CrossRef PubMed
- 8. Sharma S, Zapatero-Rodríguez J, O’Kennedy R. Prostate cancer diagnostics: clinical challenges and the ongoing need for disruptive and effective diagnostic tools. Biotechnol Adv. 2017;35(2):135-149. CrossRef PubMed
- 9. Buschow SI, Liefhebber JM, Wubbolts R, Stoorvogel W. Exosomes contain ubiquitinated proteins. Blood Cells Mol Dis. 2005;35(3):398-403. CrossRef PubMed
- 10. Valadi H, Ekström K, Bossios A, Sjöstrand M, Lee JJ, Lötvall JO. Exosome-mediated transfer of mRNAs and microRNAs is a novel mechanism of genetic exchange between cells. Nat Cell Biol. 2007;9(6):654-659. CrossRef PubMed
- 11. Nilsson J, Skog J, Nordstrand A, et al. Prostate cancer-derived urine exosomes: a novel approach to biomarkers for prostate cancer. Br J Cancer. 2009;100(10):1603-1607. CrossRef PubMed
- 12. Friedman RC, Farh KK-H, Burge CB, Bartel DP. Most mammalian mRNAs are conserved targets of microRNAs. Genome Res. 2009;19(1):92-105. CrossRef PubMed
- 13. Bartel DP. MicroRNAs: genomics, biogenesis, mechanism, and function. Cell. 2004;116(2):281-297. CrossRef PubMed
- 14. Marton S, Garcia MR, Robello C, et al. Small RNAs analysis in CLL reveals a deregulation of miRNA expression and novel miRNA candidates of putative relevance in CLL pathogenesis. Leukemia. 2008;22(2):330-338. CrossRef PubMed
- 15. Mitchell PS, Parkin RK, Kroh EM, et al. Circulating microRNAs as stable blood-based markers for cancer detection. Proc Natl Acad Sci USA. 2008;105(30):10513-10518. CrossRef PubMed
- 16. Mall C, Rocke DM, Durbin-Johnson B, Weiss RH. Stability of miRNA in human urine supports its biomarker potential. Biomarkers Med. 2013;7(4):623-631. CrossRef PubMed
- 17. Markert L, Holdmann J, Klinger C, et al. Small RNAs as biomarkers to differentiate benign and malign prostate diseases: an alternative for transrectal punch biopsy of the prostate? PLoS One. 2021;16(3):e0247930. CrossRef PubMed
- 18. R Core Team. R: A Language and Environment for Statistical Computing. 2019. Online
- 19. Turewicz M, Kohl M, Ahrens M, et al. BioInfra.Prot: a comprehensive proteomics workflow including data standardization, protein inference, expression analysis and data publication. J Biotechnol. 2017;261:116-125. CrossRef PubMed
- 20. Walker A. openxlsx: Read, Write and Edit XLSX Files. 2019. Online
- 21. Kuhn M. caret: Classification and Regression Training. 2019. Online
- 22. Love MI, Huber W, Anders S. Moderated estimation of fold change and dispersion for RNA-seq data with DESeq2. Genome Biol. 2014;15(12):550. CrossRef PubMed
- 23. Wickham H. ggplot2: Elegant Graphics for Data Analysis. 2016. Online
- 24. Wilke CO. cowplot: Streamlined Plot Theme and Plot Annotations for ‘ggplot2’. 2019. Online
- 25. Slowikowski K. ggrepel: Automatically Position Non-Overlapping Text Labels with ‘ggplot2’. 2019. Online
- 26. Robin X, Turck N, Hainard A, et al. pROC: an open-source package for R and S+ to analyze and compare ROC curves. BMC Bioinformatics. 2011;12(1):77. CrossRef PubMed
- 27. Breiman L. Random Forests. Mach Learn. 2001;45(1):5-32. CrossRef
- 28. Liaw A, Wiener M. Classification and regression by randomForest. R News. 2002;2(3):18-22.
- 29. Griffiths-Jones S. The microRNA Registry. Nucleic Acids Res. 2004;32(Database issue)(suppl 1):D109-D111. CrossRef PubMed
- 30. Yamada Y, Arai T, Kato M, et al. Role of pre-miR-532 (miR-532-5p and miR-532-3p) in regulation of gene expression and molecular pathogenesis in renal cell carcinoma. Am J Clin Exp Urol. 2019;7(1):11-30. PubMed
- 31. Han J, Wang F, Lan Y, et al. KIFC1 regulated by miR-532-3p promotes epithelial-to-mesenchymal transition and metastasis of hepatocellular carcinoma via gankyrin/AKT signaling. Oncogene. 2019;38(3):406-420. CrossRef PubMed
- 32. Gu C, Cai J, Xu Z, et al. MiR-532-3p suppresses colorectal cancer progression by disrupting the ETS1/TGM2 axis-mediated Wnt/β-catenin signaling. Cell Death Dis. 2019;10(10):739. CrossRef PubMed
- 33. Jiang W, Zheng L, Yan Q, Chen L, Wang X. MiR-532-3p inhibits metastasis and proliferation of non-small cell lung cancer by targeting FOXP3. J BUON. 2019;24(6):2287-2293. PubMed
- 34. Andl T, Ganapathy K, Bossan A, Chakrabarti R. MicroRNAs as guardians of the prostate: those who stand before cancer. What do we really know about the role of microRNAs in prostate biology? Int J Mol Sci. 2020;21(13):4796. CrossRef PubMed
- 35. Guo J, Liu C, Wang W, et al. Identification of serum miR-1915-3p and miR-455-3p as biomarkers for breast cancer. PLoS One. 2018;13(7):e0200716-e. CrossRef PubMed
- 36. Li K, Zhu X, Li L, et al. Identification of non-invasive biomarkers for predicting the radiosensitivity of nasopharyngeal carcinoma from serum microRNAs. Sci Rep. 2020;10(1):5161. CrossRef PubMed
- 37. Zou X, Li M, Huang Z, et al. Circulating miR-532-502 cluster derived from chromosome X as biomarkers for diagnosis of breast cancer. Gene. 2020;722:144104. CrossRef PubMed
- 38. Pospisilova S, Pazourkova E, Horinek A, et al. MicroRNAs in urine supernatant as potential non-invasive markers for bladder cancer detection. Neoplasma. 2016;63(5):799-808. CrossRef PubMed
- 39. Liang Y, Ridzon D, Wong L, Chen C. Characterization of microRNA expression profiles in normal human tissues. BMC Genomics. 2007;8(1):166. CrossRef PubMed
- 40. Thomas CE, Sexton W, Benson K, Sutphen R, Koomen J. Urine collection and processing for protein biomarker discovery and quantification. Cancer Epidemiol Biomarkers Prev. 2010;19(4):953-959. CrossRef PubMed