|
J Circ Biomark 2020; 9(1): 1-7 DOI: 10.33393/jcb.2020.2121 ORIGINAL RESEARCH ARTICLE |
Exploring adipogenic and myogenic circulatory biomarkers of recurrent pressure injury risk for persons with spinal cord injury
ABSTRACT
Purpose: To investigate linkages between circulatory adipogenic and myogenic biomarkers, gluteal intramuscular adipose tissue (IMAT), and pressure injury (PrI) history following spinal cord injury (SCI).
Methods: This is an observational repeated-measures study of 30 individuals with SCI. Whole blood was collected regularly over 2-3 years. Circulatory adipogenic and myogenic gene expression was determined. IMAT was defined as above/below 15% (IMATd) or percentage (IMAT%). PrI history was defined as recurrent PrI (RPrI) or PrI number (nPrI). Model development used R packages (version 3.5.1). Univariate analysis screened for discriminating genes for downstream multivariate and combined models of averaged and longitudinal data for binary (RPrI/IMATd) and finer scales (nPrI/IMAT%).
Results: For adipogenesis, Krüppel-like factor 4 was the top RPrI predictor together with resistin and cyclin D1, and sirtuin 2 was the top IMAT predictor. For myogenesis, the top RPrI predictor was dysferlin 2B, and pyruvate dehydrogenase kinase-4 was the top IMAT predictor together with dystrophin.
Conclusion: Circulatory adipogenic and myogenic biomarkers have statistically significant relationships with PrI history and IMAT for persons with SCI. Biomarkers of interest may act synergistically or additively. Variable importance rankings can reveal nonlinear correlations among the predictors. Biomarkers of interest may act synergistically or additively, thus multiple genes may need to be included for prediction with finer distinction.
Keywords: Adipogenesis genes, Circulatory biomarkers, Myogenesis genes, Recurrent pressure injury, Spinal cord injury
Received: April 9, 2020
Accepted: August 18, 2020
Published online: September 21, 2020
© 2020 The Authors. This article is published by AboutScience and licensed under Creative Commons Attribution-NonCommercial 4.0 International (CC BY-NC 4.0). Any commercial use is not permitted and is subject to Publisher’s permissions. Full information is available at www.aboutscience.eu
Introduction
Pressure injuries (PrIs) are defined as localized damage to skin and underlying soft tissue that develops due to intense and/or prolonged pressure or pressure combined with shearing (1). PrI can present as intact skin or as open ulcers and can take months or years to heal once developed. Development and/or recurrence of a PrI limits activities of daily living, often leading to hospitalization and even death. Padula et al (2) reported that from 2011 to 2014 there were 60,000 reported deaths due to PrI. PrI management is also expensive: Management of hospital-acquired PrI (HAPI) alone has been reported to cost US healthcare over $26 billion annually (3). Management costs for community-acquired PrI have yet to be determined but may be presumed to be at least $8 billion (30% of HAPI costs).
Spinal cord injury (SCI) is defined as damage to any part of the spinal cord or nerves at the end of the spinal canal. Traumatic SCI occurs suddenly due to a blow or cut to the spine, such as can occur in a motor vehicle accident or fall. SCI often leads to permanent loss of strength, sensation, and function below the site of the injury. A complete SCI will result in total loss of all motor and sensory function below the level of injury, while with an incomplete SCI there can be some sensory and/or motor function retained. During the acute and subacute stages following injury, there can be some neurorecovery. Once neurorecovery has plateaued, the condition is considered to be chronic SCI (4). This is most commonly considered to be 1 year following traumatic injury.
Persons with SCI remain at risk for PrI development throughout their lifetime and often develop community-acquired PrI. PrI remain one of the most devastating secondary complications for persons living with SCI. It remains unclear why some persons with SCI suffer from a continuous cycle of recurring PrI, while others remain PrI free.
The National Pressure Injury Advisory Panel has recognized that some PrI might be unavoidable due to complex and systemic intrinsic factors (5). In response to these intrinsic factors, biomarkers that signal tissue health status are released into circulation. Circulatory messenger ribonucleic acid (mRNA) biomarkers related to fatty metabolism, which are valuable risk indicators for PrI risk, have previously been reported (6). Factors that regulate and control downstream biomarker production related to fatty metabolism, specifically adipogenesis and myogenesis, are thus of interest for determining the risk of developing recurrent PrI (RPrI).
The study objective was to evaluate relationships between circulatory adipogenic and myogenic biomarkers, PrI history, and muscle composition, in persons with chronic SCI, by secondary analysis of preexisting blood samples.
Methods
A repeated-measures study design was employed. Individuals with complete or incomplete SCI were recruited: Exclusion criteria included having an open pelvic region PrI and presence of a systemic disease. A comprehensive demographic profile was obtained at enrolment. Whole blood samples were obtained every 6 to 12 months over 2-3 years. The study was carried out at a tertiary care facility. All clinical study activities were reviewed and approved by the local Institutional Review Board and by the US Army Human Research Protection Office.
Blood sample collection
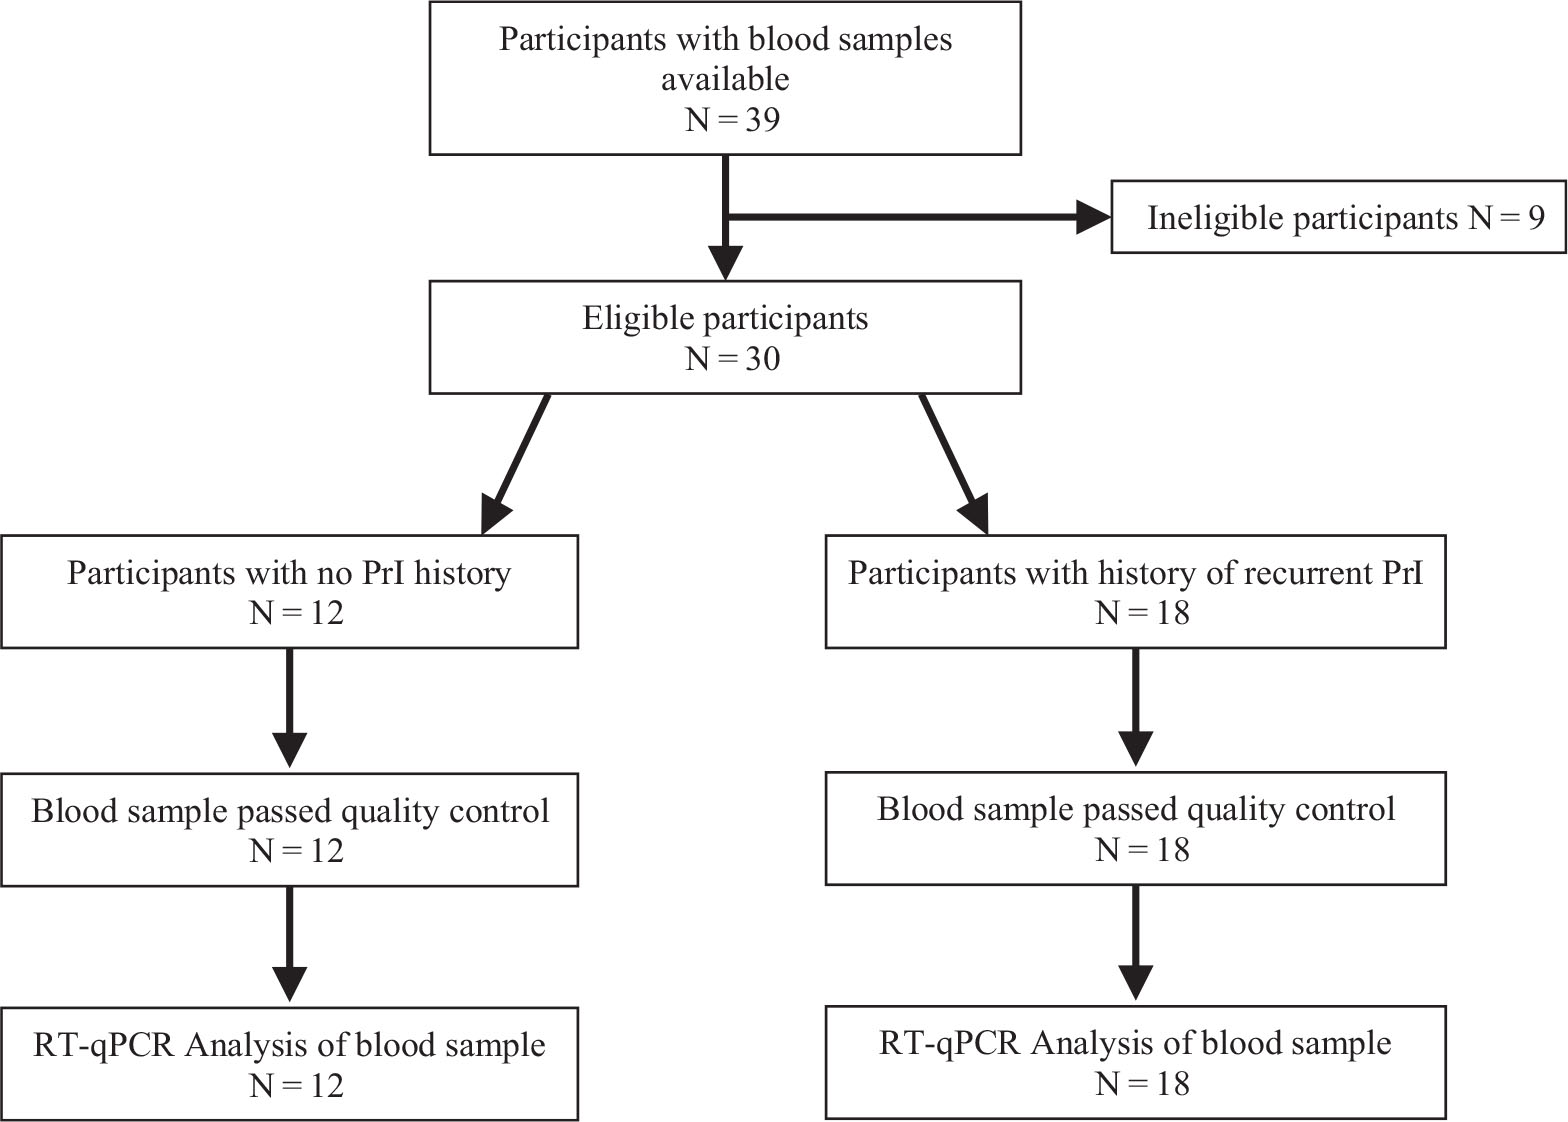
Whole blood samples were collected for quantitative reverse transcription polymerase chain reaction (RT-qPCR) analysis. Samples were frozen immediately in a −80°C freezer prior to further processing. Samples from participants who met the eligibility criteria of either having no PrI history or having a history of RPrI were selected for secondary analysis focused on circulatory adipogenic and myogenic biomarkers (Fig. 1).
RT-qPCR analysis
RNA was extracted from whole blood samples using QIAzol Lysis reagent and the Qiagen Mini Kit (Qiagen, Valencia, CA) following the RNA extraction protocol provided in each kit. Immediately following completion of RNA isolation, sample concentration was measured using the NanoDrop ND-2000. Sample yields between 25 and 200 ng/μL of RNA and A260:A280 ratios between 1.8 and 2.0 were used for further processing. RNA Integrity Number (RIN) was determined using fluorometric quantification (Qubit, Fisher Scientific Singapore) and confirmed using the Agilent Bioanalyzer. Verification of 18S and 28S ribosomal RNA integrity was analyzed by agarose gel electrophoresis and Agilent Bioanalyzer electropherograms.
The thermocycler was used for complementary deoxyribonucleic acid (cDNA) synthesis; 200 ng RNA from each sample was mixed with Buffer GE and nuclease-free water from the Qiagen RT2 First Strand kit (Qiagen, Valencia, CA). At stage 2, the RT mix (Qiagen, RT2 First Strand Kit, Valencia, CA) was added to the RNA solution and the sample was left to run for the remaining stages. Nuclease-free water (Qiagen, RT2 First Strand Kit, Valencia, CA) was added after cDNA synthesis was completed. The cDNA was mixed with nuclease-free water (Qiagen, Valencia, CA) and SYBR Green ROX qPCR Master Mix (Qiagen, Valencia, CA) based on the Qiagen RT2 Profiler PCR array handbook. Commercially available custom RT2 Profiler PCR array plates (PAHS-049ZA and PAHS-099ZA) were employed to determine expression of over 100 genes involved in adipogenesis and myogenesis.
RT-qPCR analysis was run using a 96-fast plate SYBR Green qPCR protocol on an ABI ViiA7 platform (Applied Biosystems, Foster City, CA, USA) by the standard curve method. Each well contained 25 μL total reaction volume. The protocol included 1 cycle for 10 minutes at 95°C to activate the HotStart DNA Taq Polymerase followed by 40 cycles of 2-step RT-qPCR, including 15 seconds at 95°C and 1 minute at 60°C where fluorescence data collection was performed. Ramp rates were adjusted to 1°C/s. Lastly, a 1-cycle melting curve verified RT-qPCR specificity according to the RT2 Profiler PCR array handbook.
Raw Ct (cycle threshold) values were loaded into qbase+ software (BioGazelle, Zwijnaarde, Belgium) to compute Calibrated Normalized Relative Quantities (CNRQ) for further data analysis. Inhibition testing used RT control and positive PCR control wells on the custom array plates. Ct values across all PCR array runs were analyzed for sufficient quality by the value of the CTPPC wells of 20±2. Values outside this threshold were eliminated from analysis. General DNA contamination was observed by analyzing the raw Ct values of the human genomic DNA contamination (HGDC) well on each plate and eliminating sample runs with values less than 35 Ct in the HGDC well. A control Ct value less than 35 indicated the presence of detectable genomic DNA contamination as recommended by the Qiagen RT2 Profiler PCR array handbook.
References genes (beta-2-microglobulin, actin, hypoxanthine phosphoribosyltransferase-1, and large ribosomal protein P0) were included in custom plate arrays from Qiagen. Normalization methods were automated through qbase+ software.
Gluteal intramuscular adipose tissue (IMAT) content was determined following a previously developed standardized protocol (7).
Demographics
Repeated evaluations were completed for 30 participants with complete or incomplete SCI. Study participants had either a history of multiple PrI (Group I) or no history of PrI (Group II). Study groups were comparable with respect to standard demographic measures as shown in Table I.
Statistical methods
As with most studies using multivariate PCR arrays, not all genes were present for all samples. Merely deleting any gene (the column variable) or any observation (the row variable) with any missing values would both eliminate too many observations and lead to a biased sample, since there is a low detection limit (LDL) for each gene. In the current study, genes with more than 70% missing were excluded from all analysis. To overcome the LDL issue, missing values for the remaining genes were imputed before a downstream analysis and the missing information directly incorporated in the next stage analysis. The imputed values were determined to be an estimated conditional mean of gene expression, given that the expression is known to be smaller than the detection limit defined by qbase+, or a scaled minimum observed value, as suggested by Nie et al (8). The minimum observed values of normalized expressions were negative if gene activity was less than the normalization factors. We examined the effect of imputation by the conditional mean, and 1, √2, and 2 times the minimum observed. It was found that each approach gave similar results. Hence, the results using √2 as the scaling factor are presented.
| Group I PrI | Group II No PrI | ||||
|---|---|---|---|---|---|
| N | 29 | 18 | 12 | ||
| Age at injury | Range | 22-75 | 22-71 | ||
| Mean | 46.3 | 50.2 | |||
| Age at study | Range | 33-81 | 30-74 | ||
| Mean | 57.5 | 57.6 | |||
| Sex | Male | 16 | 89% | 11 | 92% |
| Female | 2 | 11% | 1 | 8% | |
| Duration of injury | Range | 9 mo-46 y | 1 mo–34 y | ||
| Mean | 13.8 y | 7.5 y | |||
| Neurological level | Above T6 | 12 | 67% | 9 | 75% |
| Below T6 | 6 | 33% | 3 | 25% | |
| ASIA Level | Complete (AIS = A) | 7 | 39% | 2 | 17% |
| Incomplete (AIS = B,C,D) | 11 | 61% | 10 | 83% | |
AIS = American Spinal Injury Association Impairment Scale; PrI = pressure injury.
Comprehensive analyses were carried out on data with longitudinal repeated measures and on data averaged over time to find the factors that influence Prl outcomes. Meaningful outcomes were defined as the number of Prl (nPrl) and the percent of IMAT (IMAT%) since IMAT has been found to be a major risk factor for Prl in earlier analysis (7,9). The dichotomized versions of these two outcomes were “with or without pressure injury” (RPrl) and “below or above 15% IMAT” (IMATd).
Data analyses were performed using statistical software program R (version 3.5.1) with packages rpart (for tree-based modeling), lme4 (for linear mixed effects modeling), geepack (for Generalized Estimating Equation [GEE] modeling), glmnet (for least absolute shrinkage and selection operator [LASSO] on generalized linear models), and glmmLasso (for LASSO on generalized linear mixed models). Due to the large number of genes relative to the number of subjects (large p problem), our comprehensive analyses included univariate, multivariate, and combined analyses.
Univariate analyses
Each gene was examined to see if it was discriminated between the dichotomized outcomes of interest, specifically RPrI and IMATd. The statistical methods for group comparisons are given below:
Group comparison via confidence interval on data averaged over time
For each gene, the t- and bootstrap confidence intervals (CIs) of each group mean were used to check the CI overlap for contrasting groups. The absence of any overlap approximated a significant group mean difference at 0.05, based on the CI levels recommended by Payton et al (10).
Group comparison via survival models
Gene expression data can be considered as left-censored data, that is, values below the detection limit are censored. Thus, survival models were applied treating data without missing values as an event and data with missing values as censored. In this case, “longer survival time” is equivalent to higher gene expression values. Both a parametric procedure based on the log-normal distribution and the Kaplan–Meier, a nonparametric survival analysis procedure, were used to check group differences based on RPrI and IMATd for each gene.
Variable importance rankings from the parametric model are presented for important adipogenesis (Tab. II) and myogenesis genes (Tab. III). Genes selected by this prescreening procedure were then included for downstream analyses using multivariate and combined approaches.
Multivariate analyses
Tree-based models and penalized regression procedures using LASSO are suitable for finding important factors for large-p data. For averaged data over time, tree-based models on dichotomized RPrI and IMATd including all eligible genes were first performed. Tree-based models handle missing values by using surrogates. The variable importance ranking from these models is indicative of the candidate genes for the final modeling.
LASSO preforms variable selection and prediction from a complex dataset simultaneously. Two LASSO R packages were used: glmnet for averaged data and glmmLasso for longitudinal data with a random intercept. Variables of interest were also analyzed on the finer scale. Poisson regression was applied to nPrI. Gaussian regression was applied to the logit transformed IMAT%.
For averaged data, the penalization level was set by both fivefold cross-validation (CV) and minimizing the Bayesian information criterion (BIC). For longitudinal data the penalization level was set only by minimizing BIC due to high computational cost in using CV.
| Gene name | Standard abbreviation | Ranking |
|---|---|---|
| (a) RPrI as outcome | ||
| IMAT% | 6.01 | |
| Kruppel-like factor 4 | KLF4 | 3.21 |
| Retinoblastoma 1 | RB1 | 2.25 |
| Cyclin-dependent kinase inhibitor 1A | CDKN1A | 1.50 |
| Fatty acid synthase | FASN | 1.50 |
| Insulin receptor substrate 2 | IRS2 | 1.50 |
| Lamin A/C | LMNA | 1.50 |
| (b) IMATd as outcome | ||
| Sirtuin 2 | SIRT2 | 4.80 |
| Complement factor D (adipsin) | CFD | 2.40 |
| Cyclin-dependent kinase inhibitor 1B | CDKN1B | 1.92 |
| Insulin receptor substrate 2 | IRS2 | 1.92 |
| Sterol regulatory element binding transcription factor 1 | SREBF1 | 1.92 |
| Tafazzin | TAZ | 1.92 |
IMATd = below or above 15% intramuscular adipose tissue; RPrI = recurrent pressure injury.
| Gene name | Standard abbreviation | Ranking |
|---|---|---|
| (a) RPrI as outcome | ||
| IMAT% | 6.01 | |
| Dysferlin 2B | DYSF2B | 2.76 |
| Mitogen-activated protein kinase 1 | MAPK1 | 2.76 |
| Lamin A/C | LMNA | 2.25 |
| Calpain 3 | CAPN3 | 1.88 |
| AKT serine/threonine kinase 1 | AKT1 | 1.50 |
| Mitogen-activated protein kinase 14 | MAPK 14 | 1.50 |
| Caspase 3, apoptosis related | CASP3AR | 1.26 |
| Adrenoceptor beta 2 | ADRB2 | 1.26 |
| Myocyte enhancer factor 2C | MEF2C | 1.26 |
| (b) IMATd as outcome | ||
| Pyruvate dehydrogenase kinase 4 | PDK4 | 5.09 |
| Lamin A/C | LMNA | 2.78 |
| Matrix metallopeptidase 9 | MMP9 | 2.78 |
| Transforming growth factor beta 1 | TGFB1 | 2.78 |
| Ribosomal protein S6 kinase, polypeptide 1 | RPS6KA1 | 2.31 |
| Utrophin | UTRN | 2.31 |
IMATd = below or above 15% intramuscular adipose tissue; RPrI = recurrent pressure injury.
GEEs using the selected genes from longitudinal LASSO were also fit to serve as a complementary “sanity check” for the effects of the selected genes. As above, a possibly significant effect was defined as having a p< 0.05. A marginal effect was defined as having a p>0.05 but <0.10.
Regression combining the results from univariate and multivariate analyses
Genes found to be important from either the univariate analyses or one of the multivariate analyses were selected into a preliminary candidate set. A further combined analysis was then conducted using generalized linear mixed models to evaluate the feasibility of a more parsimonious model. Three candidate analysis procedures/models were applied (Tree, GLMM LASSO, and combined GLMM) using both binary (RPrI/IMATd) and finer scales (nPrI/IMAT%) on averaged data and longitudinal data with a random intercept. All the reported Poisson GLMM models passed the “over-dispersion” test.
Results
Following SCI, there is a loss of muscle mass and changes in muscle fiber type (11), which has some similarities to sarcopenia. Acutely following injury, there is a rapid and dramatic loss of muscle mass over a period of weeks or months. It has also been shown that composition of the paralyzed muscle also changes (9): dystrophic-type changes occur in muscles with the lean muscle tissue replaced by adipose tissue, that is, fatty infiltration, or IMAT, increases. These changes in composition continue, even several years following injury. IMAT has been reported to increase with aging in healthy adults (12), with an increase of around 3% annually for persons over 50 years (13). However, following SCI, the rapid IMAT accumulation seen in some individuals is occurring both more quickly and at a younger age than would be expected for sarcopenic muscle changes (9). Higher IMAT compromises tissue resilience by reducing the overall microvascularity of the affected composite muscle tissue. The remaining blood vessels are also more prone to occlude under load. These changes thus impair the response to applied loads and increase the risk of tissue breakdown and PrI development. Changes in adiposity do not appear to be associated or correlated with clinical or demographic factors such as level or extent of injury (9,14). It is also important to clarify that in the same way as cholesterol levels vary independent of body mass index (BMI), so higher levels of IMAT deposition are not correlated with SCI-adjusted BMI.
There is growing appreciation that there is increased subclinical inflammatory activity following SCI (15, 16, 17), which has recently been confirmed by functional genomics (18). When inflammation is prolonged by dysregulation, it can have harmful effects on tissue. However, prior work has shown that while inflammatory biomarkers can be detected in the circulation of persons with SCI, they are not discriminatory for RPrI risk (6). The role of fatty infiltration, or intramuscular adipose tissue, has only recently been reported (7, 9). Relationships between adipogenic and myogenic circulatory biomarkers and RPrI in persons living with SCI have not previously been reported.
In the current study, results from different models were relatively consistent for identifying most important genes with a statistically significant effect on PrI history or IMAT. All the genes with a significant p value (<0.05) for the regression modeling combining univariate and multivariate analyses were considered together with those that have a marginal p value (<0.10) from most tests.
Adipogenic circulatory biomarkers
Using RPrI as the outcome measure, IMAT% is the top variable and Krüppel-like factor (KLF4) the top adipogenesis gene that complements IMAT in predicting Prl (Tab. IIa). KLF4 supports energy demand in skeletal muscle (19) and has been suggested as a potentially significant inhibitor of adipose biology (20). When IMATd was defined as the primary model outcome, the adipogenesis tree model indicated sirtuin 2 (SIRT2) was the critical determinant (Tab. IIb). The importance of SIRT2 as an adipogenesis gene for IMAT is also shown by both GLMM with a LASSO penalty and the combined GLMM analysis (Tab. V). SIRT2 inhibits lipid synthesis, playing a role in glyceroneogenesis or fat deposition into adipose tissue (21). Thus, increased SIRT2 expression may play a role in IMAT deposition over time following SCI.
In the combined GLMM analysis for nPrI, a finer scale than RPrl, in addition to IMAT, important adipogenesis genes included GATA binding protein 2 (GATA2), resistin (RETN), and cyclin D1 (CCND1) (Tab. IV).
We also found retinoblastoma 1 (RB1) to be a significant factor in models fit for RPrI (Tab. IIa) and in the multivariate adipogenesis model using IMAT% as outcome (Tab. V). RB1 expression is an important factor in adipocyte differentiation (22). It is negatively associated with BMI in able-bodied individuals, but positively associated with adipogenesis regulators such as peroxisome proliferator-activated receptor gamma (PPARγ). Current results suggest RB1 levels are reduced in environments that limit adipogenesis. Complement factor D (CFD), also known as adipsin, is an important factor in the binary adipogenesis model with IMATd as outcome (Tab. IIb). CFD is exclusively expressed in adipose tissue and is a rate-limiting component of the alternative complement pathway that regulates innate immune response (23).
| Gene name | Standard abbreviation | Estimate | Std. | z value | Pr(>|z|) |
|---|---|---|---|---|---|
| (Intercept) | 0.359 | 0.346 | 1.04 | 0.2990 | |
| IMAT% | 2.479 | 0.852 | 2.91 | 0.0036 | |
| GATA binding protein 2 | GATA2 | 0.355 | 0.890 | 0.4 | 0.6900 |
| Resistin | RETN | 1.116 | 0.694 | 1.61 | 0.1080 |
| Cyclin D1 | CCND1 | 0.582 | 0.246 | 2.36 | 0.0180 |
| Months | −0.001 | 0.016 | −0.05 | 0.9599 |
IMAT = intramuscular adipose tissue; nPrI = recurrent pressure injury number.
| Gene name | Standard abbreviation | Estimate | Std. | t value | Pr(>|t|) |
|---|---|---|---|---|---|
| (Intercept) | −2.252 | 0.408 | −5.53 | 0.00001 | |
| Nuclear receptor coactivator 2 | NCOA1 | 2.453 | 1.054 | 2.33 | 0.0518 |
| Resistin | RETN | −0.964 | 0.420 | −2.29 | 0.0631 |
| Sirtuin 2 | SIRT2 | 1.486 | 0.599 | 2.48 | 0.0448 |
| Sirtuin 3 | SIRT3 | −2.621 | 0.584 | −4.49 | 0.0034 |
| retinoblastoma 1 | RB1 | −3.328 | 0.648 | −5.14 | 0.0015 |
| retinoid X receptor, alpha | RXRA | 2.658 | 0.648 | 4.10 | 0.0074 |
| Months | −0.051 | 0.010 | −5.08 | 0.0017 |
IMAT = intramuscular adipose tissue.
Myogenic circulatory biomarkers
For myogenesis, in addition to PrI, the top gene that works with IMAT is dysferlin 2B (DYSF2B) to predict RPrI (Tab. IIIa) and pyruvate dehydrogenase kinase 4 (PDK4) for predicting IMATd (Tab. IIIb). Although included on a myogenesis panel, PDK4 also contributes to glucose metabolism regulation, facilitating glyceroneogenesis and triacylglycerol storage (24). The current models also showed PDK4 to be a useful but not significant factor in multivariate myogenesis models with IMAT as the outcome (Tab. VII).
The binary myogenesis tree model (Tab. IIIa) indicates that DYSF2B expression is a myogenic determinant for RPrI. Lack of DYSF2B causes changes in myofiber repair, alters calcium homeostasis, and causes chronic muscle inflammation (25). Muscle loss due to myofiber replacement with fibrotic or adipogenic tissue is well known in chronic muscle injuries, but has not previously been studied in persons with chronic SCI. Muscle damage and regeneration are exacerbated by increased levels of fibro/adipogenic precursors (FAPs), which cause adipogenic replacement of muscle fibers in tissues with mutated dysferlin (25).
GLMM with a LASSO penalty indicated DYSF2B as an important gene in the multivariate myogenesis models for nPrl (Tab. VI). For the combined GLMM analysis, dystrophin (DMD) also appeared to be more significant in the combined model when logit(IMAT) is the outcome measure (Tab. VII). PDK4 was also included in the final models but with p values larger than 0.10 (Tab. VII).
Limitations
This exploratory study involved a moderately sized cohort followed for up to 3 years. Variations between univariate and multivariate models for adipogenesis indicate some difference in pathways for PrI development and IMAT. For myogenesis, the results across all analyses are more consistent. Further work is needed to clarify the impact on PrI risk over time of genes of interest involved in adipogenesis and myogenesis.
| Gene name | Standard abbreviation | Estimate | Std. | z value | Pr(>|z|) |
|---|---|---|---|---|---|
| (Intercept) | −0.220 | 0.297 | −0.74 | 0.4595 | |
| IMAT% | 2.674 | 0.859 | 3.11 | 0.0019 | |
| Dysferlin 2B | DYSF2B | 1.061 | 0.692 | 1.53 | 0.1252 |
| Hexokinase 2 | HK2 | −1.132 | 1.002 | −1.13 | 0.2587 |
| Interleukin 1, beta | IL-1B | 1.138 | 0.806 | 1.41 | 0.1578 |
| Months | −0.003 | 0.016 | −0.18 | 0.8608 |
IMAT = intramuscular adipose tissue; nPrI = recurrent pressure injury number.
| Variable name | Standard abbreviation | Estimate | Std. | t value | Pr(>|t|) |
|---|---|---|---|---|---|
| (Intercept) | −2.067 | 0.376 | −5.49 | 0.000003 | |
| Matrix metallopeptidase 9 | MMP9 | 0.641 | 0.621 | 1.03 | 0.3100 |
| Pyruvate dehydrogenase kinase 4 | PDK4 | 0.173 | 0.644 | 0.27 | 0.7910 |
| Dystrophin | DMD | 0.401 | 0.194 | 2.07 | 0.0490 |
| Months | 0.002 | 0.018 | 0.12 | 0.9040 |
IMAT = intramuscular adipose tissue.
Conclusions
Persons with SCI have a near-normal life expectancy if they do not develop severe secondary complications, in particular PrI. While this is a lifetime risk, it also appears that susceptibility for this devastating secondary complication is unique for each individual. These differences are not clearly associated with either level of injury or American Spinal Injury Association Impairment Scale (AIS) grade. This exploratory analysis confirms that IMAT is a major indicator for RPrI risk. Circulatory adipogenic and myogenic biomarkers have statistically significant relationships with PrI history and IMAT. The models indicated the importance of each gene based on the sum of the improvements in all nodes. Variable importance rankings can reveal nonlinear correlations among the predictors. Biomarkers of interest may act synergistically or additively, thus multiple genes may need to be included for prediction with finer distinction.
Data availability statement
Data cannot be shared publicly due to the policies of our institution. Data may be made available to researchers who meet the criteria for access to confidential data following review by the Institutional Data Access Committee (contact via Dr. KM Bogie).
Disclosures
Conflict of interest: The authors report grants from CDMRP Spinal Cord Injury Research Program and grants from Craig H. Neilsen Foundation during the conduct of the study.
Financial support: The work described in this article was supported by the CDMRP Spinal Cord Injury Research Program (grant no. W81XWH-14-1-0618) and the Craig H. Neilsen Foundation (grant no. 315537).
References
- 1. Henzel MK, Bogie KM. Medical management of pressure ulcers in patients with spinal cord disorders. In: Kirshblum S, Lin VW, eds. Spinal cord medicine, 3rd ed. Springer 2018;516-543.
- 2. Padula WV, Pronovost PJ, Makic MBF, et al. Value of hospital resources for effective pressure injury prevention: a cost-effectiveness analysis. BMJ Qual Saf. 2019 Feb;28(2):132-141.
- 3. Padula WV, Delarmente BA. The national cost of hospital-acquired pressure injuries in the United States. Int Wound J. 2019 Jun;16(3):634-640.
- 4. Burns AS, Marino RJ, Flanders AE, Flett H. Clinical diagnosis and prognosis following spinal cord injury. Handb Clin Neurol. 2012;109:47-62.
- 5. Edsberg LE, Langemo D, Baharestani MM, Posthauer ME, Goldberg M. Unavoidable pressure injury: state of the science and consensus outcomes. J Wound Ostomy Continence Nurs. 2014 Jul-Aug;41(4):313-334.
- 6. Schwartz K, Henzel MK, Ann Richmond M, et al. Biomarkers for recurrent pressure injury risk in persons with spinal cord injury. J Spinal Cord Med. 2019 Sep 6:1-8.
- 7. Wu GA, Bogie KM. Not just quantity: gluteus maximus muscle characteristics in able-bodied and SCI individuals--implications for tissue viability. J Tissue Viability. 2013 Aug;22(3):74-82.
- 8. Nie L, Chu H, Liu C, Cole SR, Vexler A, Schisterman EF. Linear regression with an independent variable subject to a detection limit. Epidemiology. 2010 Jul;21 Suppl 4:S17-S24.
- 9. Lemmer DP, Alvarado N, Henzel K, et al. What lies beneath: why some pressure injuries may be unpreventable for individuals with spinal cord injury. Arch Phys Med Rehabil. 2019 Jun;100(6):1042-1049.
- 10. Payton ME, Greenstone MH, Schenker N. Overlapping confidence intervals or standard error intervals: what do they mean in terms of statistical significance? J Insect Sci. 2003;3:34.
- 11. Castro MJ, Apple DF Jr, Staron RS, Campos GE, Dudley GA. Influence of complete spinal cord injury on skeletal muscle within 6 mo of injury. J Appl Physiol. 1999 Jan;86(1):350-358.
- 12. Marcus RL, Addison O, Kidde JP, Dibble LE, Lastayo PC. Skeletal muscle fat infiltration: impact of age, inactivity, and exercise. J Nutr Health Aging. 2010 May;14(5):362-366.
- 13. Yoshiko A, Hioki M, Kanehira N, et al. Three-dimensional comparison of intramuscular fat content between young and old adults. BMC Med Imaging. 2017 Feb 10;17(1):12.
- 14. Farkas GJ, Gorgey AS, Dolbow DR, Berg AS, Gater DR. The influence of level of spinal cord injury on adipose tissue and its relationship to inflammatory adipokines and cardiometabolic profiles. J Spinal Cord Med. 2018 Jul;41(4):407-415.
- 15. Wang TD, Wang YH, Huang TS, Su TC, Pan SL, Chen SY. Circulating levels of markers of inflammation and endothelial activation are increased in men with chronic spinal cord injury. J Formos Med Assoc. 2007 Nov;106(11):919-928.
- 16. Morse LR, Stolzmann K, Nguyen HP, et al. Association between mobility mode and C-reactive protein levels in men with chronic spinal cord injury. Arch Phys Med Rehabil. 2008 Apr;89(4):726-731.
- 17. Radulovic M, Bauman WA, Wecht JM, et al. Biomarkers of inflammation in persons with chronic tetraplegia. J Breath Res. 2015 May 14;9(3):036001.
- 18. Herman P, Stein A, Gibbs K, Korsunsky I, Gregersen P, Bloom O. Persons with chronic spinal cord injury have decreased natural killer cell and increased toll-like receptor/inflammatory Gene Expression. J Neurotrauma. 2018 Aug 1;35(15):1819-1829.
- 19. Hsieh PN, Fan L, Sweet DR, Jain MK. The Krüppel-Like factors and control of energy homeostasis. Endocr Rev. 2019 Feb 1;40(1):137-152. PMID: 30307551; PMCID: PMC6334632.
- 20. Eisenstein A, Carroll SH, Johnston-Cox H, Farb M, Gokce N, Ravid K. An adenosine receptor-Krüppel-like factor 4 protein axis inhibits adipogenesis. J Biol Chem. 2014 Jul 25;289(30):21071-21081.
- 21. Gomes P, Fleming Outeiro T, Cavadas C. Emerging role of Sirtuin 2 in the regulation of mammalian metabolism. Trends Pharmacol Sci. 2015 Nov;36(11):756-768.
- 22. Moreno-Navarrete JM, Petrov P, Serrano M, et al. Decreased RB1 mRNA, protein, and activity reflect obesity-induced altered adipogenic capacity in human adipose tissue. Diabetes. 2013 Jun;62(6):1923-1931.
- 23. Li Y, Zou W, Brestoff JR, Rohatgi N, et al. Fat-produced adipsin regulates inflammatory arthritis. Cell Rep. 2019 Jun 4;27(10):2809-2816.e3.
- 24. Holness MJ, Zariwala G, Walker CG, Sugden MC. Adipocyte pyruvate dehydrogenase kinase 4 expression is associated with augmented PPARγ upregulation in early-life programming of later obesity. FEBS Open Bio. 2012 Mar 5;2:32-36.
- 25. Hogarth MW, Defour A, Lazarski C, et al. Fibroadipogenic progenitors are responsible for muscle loss in limb girdle muscular dystrophy 2B. Nat Commun. 2019 Jun 3;10(1):2430.