|
Glob Reg Health Technol Assess 2024; 11: 1-16 ISSN 2283-5733 | DOI: 10.33393/grhta.2024.2601 ORIGINAL RESEARCH ARTICLE |
A pharmacoeconomic analysis from Italian guidelines for the management of prolactinomas
ABSTRACT
Background: Prolactinoma, the most common pituitary adenoma, is usually treated with dopamine agonist (DA) therapy like cabergoline. Surgery is second-line therapy, and radiotherapy is used if surgical treatment fails or in relapsing macroprolactinoma.
Objective: This study aimed to provide economic evidence for the management of prolactinoma in Italy, using a cost-of-illness and cost-utility analysis that considered various treatment options, including cabergoline, bromocriptine, temozolomide, radiation therapy, and surgical strategies.
Methods: The researchers conducted a systematic literature review for each research question on scientific databases and surveyed a panel of experts for each therapeutic procedure’s specific drivers that contributed to its total cost.
Results: The average cost of the first year of treatment was €2,558.91 and €3,287.40 for subjects with microprolactinoma and macroprolactinoma, respectively. Follow-up costs from the second to the fifth year after initial treatment were €798.13 and €1,084.59 per year in both groups. Cabergoline had an adequate cost-utility profile, with an incremental cost-effectiveness ratio (ICER) of €3,201.15 compared to bromocriptine, based on a willingness-to-pay of €40,000 per quality-adjusted life year (QALY) in the reference economy. Endoscopic surgery was more cost-effective than cabergoline, with an ICER of €44,846.64. Considering a willingness-to-pay of €40,000/QALY, the baseline findings show cabergoline to have high cost utility and endoscopic surgery just a tad above that.
Conclusions: Due to the favorable cost-utility profile and safety of surgical treatment, pituitary surgery should be considered more frequently as the initial therapeutic approach. This management choice could lead to better outcomes and an appropriate allocation of healthcare resources.
Keywords: Bromocriptine, Cabergoline, Cost-utility, ICER, Prolactinoma
Received: May 8, 2023
Accepted: November 22, 2023
Published online: January 9, 2024
This article includes supplementary material
Global & Regional Health Technology Assessment - ISSN 2283-5733 - www.aboutscience.eu/grhta
© 2024 The Authors. This article is published by AboutScience and licensed under Creative Commons Attribution-NonCommercial 4.0 International (CC BY-NC 4.0).
Commercial use is not permitted and is subject to Publisher’s permissions. Full information is available at www.aboutscience.eu
Introduction
Prolactinoma is the most common prevalent type of pituitary adenoma, accounting for approximately 50% of all pituitary adenomas. The worldwide prevalence of prolactinoma is estimated to be around 50 cases per 100,000 population, with an annual incidence of 3-5 new cases per 100,000 individuals every year (1,2).
Based on tumor size, prolactinoma is classified as microprolactinoma (microP), <10 mm in diameter, or macroprolactinoma (MP), ≥10 mm in diameter. MicroPs are mainly found in women of childbearing age and MPs in men over 50.
In some cases, the adenoma produces other hormones in addition to prolactin (PRL; mainly growth hormone [GH]). PRL-secreting carcinomas are very rare and defined only by the presence of metastases (3). In most cases prolactinoma is a sporadic disease, but sometimes it can appear as part of genetic syndromes (1.5%-3% of cases), especially multiple endocrine neoplasia type 1 (MEN-1) (4) and familial isolated pituitary adenoma (FIPA) (5).
Morbidity (diabetes, cardiovascular disease, and cancer) is not increased (6) but in MPs there is an early mortality, possibly due directly or indirectly to the associated hypopituitarism.
In 2022, the Italian guidelines (GL) for the treatment of prolactinomas were developed through a collaborative effort between the Italian Association of Clinical Endocrinologists (AME) and other national scientific societies involved in the management of PRL-secreting pituitary adenomas. This initiative aimed to provide evidence-based recommendations for the management of prolactinomas in Italy.
The development process of these guidelines followed the methodological approach developed by the National Centre for Clinical Excellence, Quality, and Safety of Care (Centro Nazionale per l’Eccellenza Clinica, la Qualità e la Sicurezza delle Cure, CNEC) (7) with a focus on the recourse to high-quality evidence. This approach incorporates an Evidence to Decision Framework (EtD) to guide the decision-making process, ensuring the assessment of various factors (i.e., resource utilization, outcomes, equity, acceptability, and feasibility) when formulating recommendations. The EtD provides a transparent and structured tool to incorporate evidence on benefits and harms, outcomes, resource use, equity, acceptability, and feasibility (8).
For this GL a multidisciplinary panel, consisting of clinical and methodological experts, was appointed with the aim to assess treatment strategies for PRL-secreting pituitary adenomas.
As suggested by the international guidelines from the Endocrine Society in 2011 (9) and the GL in 2022 (10), dopamine agonist (DA) is the standard first-line treatment approach for prolactinomas: it normalizes serum PRL levels in nearly 90% of patients with microP and in 75%-80% of patients with MP (11). Tumor shrinkage is reported in more than 90% of treatment-naïve MP patients (12). Cabergoline (Cab) and bromocriptine (Br) are the two DA that are available in Italy. The 2006 Pituitary Society guidelines for the management of prolactinomas (13) and the 2022 Italian Position statement for clinical practice (14) state that Cab is the first choice DA due to its efficacy, tolerability, and sustained effect. DA adverse events are usually transient and mild to moderate in severity. DA resistance is defined as the failure to normalize serum PRL levels and to achieve an at least 50% tumor size reduction on the maximally tolerated dose (15). DA resistance is more frequent in MP, in invasive tumors, and in male subjects (16). The opportunity of DA treatment discontinuation after long-term clinical and hormonal normalization (over 2 years) remains a partially unsettled issue (17).
After the introduction of DA, 50 years ago, neurosurgical therapy was discarded as the initial treatment and considered as a second-line therapy only. It was considered as appropriate only in case of resistance, escape, or intolerance to DA, after spontaneous or DA-induced cerebrospinal fluid leakage, or in patients unwilling for chronic treatment (13). However, due to the technical improvement of pituitary surgery, transsphenoidal surgery could now be considered as a first-line management option, given its high efficacy rate in expert hands. In a recent meta-analysis, long-term disease remission after surgery was achieved in 74% of patients, regardless of the employed surgical technique (18). Specifically, long-term remission is reported in 83% of microP and in 60% of MP. Notably, remission rate rose to 89% for those MPs that were still confined within the sella turcica (18).The rate of major complications was as low as 1%-4% (19) and postsurgical recurrences were detected in up to 18% of cases at 5 years (20).
Patients who are partially resistant to medical treatment may benefit from neurosurgery even if only an incomplete tumor resection may be achieved (14) Surgical debulking may improve hormonal control, decreasing the postoperative dosage of Cab (21). After unsuccessful surgical treatment, patients who remain unresponsive to DA treatment should be offered radiotherapy (16), while surgery may be repeated in resistant or aggressive cases.
Radiotherapy is restricted to patients with surgical failure or relapsing MP and is mainly aimed at controlling tumor growth. Fractionated radiotherapy achieves tumor growth control in over 80% of cases and normalization of PRL levels in 20%-30% of the patients (22). A recent multicenter study with the use of stereotactic radiosurgery showed tumor growth control in 95% of treated adenomas and normalization of PRL levels in 43% and 54% of the patients at 5 and 8 years, respectively (23). Hypopituitarism is reported to occur in 25% of irradiated patients (23).
Chemotherapy should be considered in the minority of patients with resistance to DA therapy when, after surgical and radiation treatments, the tumor shows an unrelenting and rapid growth (1,24). The only treatment approved in this setting is temozolomide (25).
Objective
The primary objective of this study was to assess the cost implications associated with different treatment options for prolactinoma, aiming to complement the existing evidence on their clinical effectiveness. These treatments include pharmacological alternatives such as Cab, Br, and temozolomide, as well as radiation therapy and surgical strategies employing endoscopic and microscopic techniques. The analysis was conducted from the perspective of the Italian National Health Service (NHS), integrated by a partial analysis of the social impact because it limited productivity losses related to the absence of patients and their carers from work. A further objective of the analysis was to assess the cost-utility profile of the alternatives to inform the policy making. The last goal was to provide comprehensive recommendations for the most cost-utility and efficient approaches to managing prolactinoma within the Italian NHS.
Methods
Literature review
The analysis entailed a first phase aimed to gather the available scientific economic evidence through a literature review considering resources in making recommendations. The GL panel, the most significant source of information, played a pivotal role in developing the guidelines. The panel, consisting of 10 clinicians, was carefully composed following the principles of multiprofessionalism and multidisciplinarity. This diverse group included five endocrinologists, three neurosurgeons, one radiation oncologist, and one neuro-oncologist, forming a team of highly experienced clinical professionals. This assembly of expert clinicians was responsible for validating the PICO (Patient, Intervention, Comparison, Outcome) model, which subsequently served as the foundation for various research activities, including literature reviews, meta-analyses, and economic analyses.
A systematic search was performed on the following scientific databases: MEDLINE, Embase, CINAHL, and Web of Science (since inception to January 2021) to identify full economic evaluations (i.e., cost-effectiveness/cost-utility/cost-benefit analyses) related to interventions for PRL-secreting pituitary adenomas. The search strategy for MEDLINE is shown in Supplementary Table 1.
| Health status | Utility
[alpha; beta] |
Distribution |
|---|---|---|
| Health-related quality of life | ||
| Hypopituitarism | 0.80 [4.2; 1.05] | Beta |
| Complications after surgery | 0.50 [12; 12] | Beta |
| Complications after failure/relapse | 0.40 [14.6; 21.9] | Beta |
| Diabetes insipidus | 0.70 [6.8; 2.91] | Beta |
| Resistant prolactinoma | 0.60 [9.4; 6.27] | Beta |
| Treatment with bromocriptine | 0.80 [4.2; 1.05] | Beta |
| Treatment with cabergoline | 0.90 [1.6; 0.18] | Beta |
| Surgical cure | 1.00 [−1; 0] | Beta |
No time or language limits were imposed for all the searches. References of retrieved items were searched for further studies meeting inclusion criteria. The review retrieved neither studies referring to the Italian context about the resources needed for the provision of the treatments under analysis nor their sustainability profile but was useful to determine the parameters to be considered in the economic valorization of the clinical therapeutic alternatives under analysis in the Italian setting.
Survey
A survey was conducted among the members of the GL panel from various disciplines and regional healthcare systems in order to reconstruct a scenario consistent with the Italian clinical practice for the treatment of prolactinoma. The purpose of this survey was to investigate the parameters involved in the implementation of the therapeutic strategies being assessed. Treatments with Cab, Br, transsphenoidal surgery—with either microscopic or endoscopic technique—radiation treatment, or temozolomide were evaluated. For each pharmacological approach the survey investigated the following aspects: the average dosage, the number and type of diagnostic tests and visits provided for patients’ initial assessment, the number and type of yearly diagnostic tests and visits for patients’ follow-up. As to the other interventions, the survey investigated the number and type of diagnostic tests and visits provided in the prehospitalization phase, the total duration of the interventions, the drugs and average doses used during the interventions, the number, type, and time dedicated to each of the phases of the provision process by the professionals involved as well as the type and quantity of the employed disposable materials. The analysis also investigated the rates of recourse to all available alternatives in the clinical practice to estimate the average weighted cost per patient irrespective of the chosen treatment strategy. As the analysis considered the society perspective, the percentage of patients requiring support by a caregiver during and after the procedure was also investigated to obtain an estimate of the productivity losses sustained by patients and caregivers associated with the provision of the treatments under analysis.
Micro-costing analysis
As to the economic valorization of the results achieved in the survey, a micro-costing analysis was performed. The developed micro-costing framework was based on standard methods of cost gathering and previous examples of micro-costing (26-31). This methodology allows for the identification of resources associated with the provision of the treatments and a more precise assessment of the costs of the healthcare interventions considered. Micro-costing is a valuation method commonly used in health economics, focusing on evaluating individual services or specific interventions over a given period of time. The primary aim of this approach is to achieve precise measurements of costs and benefits related to the provision of healthcare services (26,30) by taking into account both fixed and variable costs associated with care and considering local prices and the institutional frameworks where the care is delivered. One of the key features of micro-costing is its effort to incorporate all possible costs related to the service, even those that might not be readily observable (for instance, patients’ and families’ time dedicated to provision of the therapies) (26,30). To account for these, micro-costing may use shadow prices or employ various interpolation methods. By employing the micro-costing method, researchers and policymakers can obtain a more comprehensive and accurate understanding of the true costs of healthcare interventions, enabling informed decision-making and resource allocation in the healthcare sector (26,30). In the context of this study, the micro-costing method was adopted to allow a detailed and accurate analysis of the costs associated with different pharmacological and surgical treatments for prolactinomas. This approach allows a complete and accurate understanding of the direct and indirect costs associated with a specific intervention or process, helping to provide a solid basis for cost analysis and evaluation of the cost-effectiveness of the strategies or interventions under consideration.
The micro-costing approach entails carrying out the following phases:
- Resources identification, where the resources necessary for the provision of the therapies under analysis are identified, defining roles and timing of each phase as well as the segments into which the process can be divided, thus allowing the costs to be associated with each operation performed or unit of material used, and allowing the total cost of such sub-activities to be estimated
- Costs measurement, involving the identification of the resources required for the provision of the treatments under analysis. To determine the cost of these resources, various sources were consulted, including the Tariff of Specialist Outpatient Service, AIFA transparency lists, and the scientific literature. For examinations and follow-up visits, the tariffs specified by the Italian Ministry of Health’s nomenclature for outpatient specialist care were used as a reference (33). Additionally, the ex-factory prices of the active ingredients used in the treatments were extracted from the AIFA transparency lists (35,36). In order to valorize the time dedicated by healthcare professionals, patients, and caregivers, as estimated through the administration of the survey, to the provision of alterative under analysis and the productivity loss of patients/caregivers, reference was made to the ARAN (34) and the Job Pricing: All About Rewards—Salary Outlook 2019 (Available at: https://www.jobpricing.it/blog/project/salary-outlook-2019-prima-edizione/) (Supplementary Table 2-6)
- Results valorization, the measured resources are then multiplied by the corresponding unit costs. This calculation yields the total costs associated with each subtotal for each category of cost (e.g., treatment, follow-up costs, and other group costs) (Supplementary Table 8-50)
- Cost aggregation, where the total costs calculated for each of the subtotals within various cost categories are summed up to derive the overall costs associated with the entire pharmacology and surgery intervention. Finally, the subtotals from each category were summed up to calculate the full cost for the entire programs (26). The results of the micro-costing analysis are expressed in terms of full annual cost of the alternatives stratified by three time intervals: first year of treatment, from the second to the fifth year, and over 5 years since the beginning of the treatments. The cost of illness estimated the annual resources associated with the provision of the therapies for each of the three time intervals since their beginning.
The study excludes the out-of-pocket expenses incurred directly by patients from calculations. This decision was guided by the analytical approach, which primarily focuses on assessing the direct and indirect costs associated with healthcare and non-healthcare factors from a societal viewpoint. It did not conduct a specific survey targeting patients; instead, the information was solely derived from healthcare providers, resulting in partial data availability. Since the questionnaire was designed for health professionals, the information on the social perspective was limited to productivity losses related to the absence of patients and their carers from work based on the duration and frequency of the administrations estimated in the survey.
Cost-utility analysis
After completing the full cost calculation using the micro-costing approach, a cost-utility analysis (CUA) (32) was carried out to estimate the value for money profile of the treatments for microP patients in the Italian healthcare setting considering a willingness-to-pay (WTP) of €40,000/quality-adjusted life year (QALY) gained (26,38).
A CUA was developed to compare the pharmacological approaches (Cab and Br) with the surgical ones (endoscopic and microscopic surgery) considering a lifetime horizon. Both the analyses considered the NHS and societal perspectives, also including indirect costs expressed in terms of productivity losses sustained by the patient or his/her caregiver. The CUA analysis considered a hypothetical cohort of 1,000 patients and is based on a probabilistic tree built on the natural history of the disease: Cab and Br were compared with the recourse to endoscopic and microscopic surgery. The outcomes were expressed in terms of QALYs gained, while the costs attributable to the analyzed interventions were those obtained through the micro-costing analysis. In accordance with the recommendations of the Italian national guidelines, costs and outcomes that occur beyond the year were reduced by applying a discount of 3.0% as per Italian national guidelines (32). The costs were valued with reference to the year 2022.
The CUA results were reported in terms of incremental cost-effectiveness ratio (ICER). The model was developed using Microsoft Excel® 365 MSO (version 2305 Build 16.0.16501.20074).
Utilities and probabilities
The analysis adapted and integrated the approach used in the study by Jethwa et al (37), where the pharmacological treatments based on Cab and Br were compared with the use of endoscopic and microscopic surgery, within the Italian healthcare setting. Table I reports the utility associated with the health states characterizing the model based on the study by Jethwa et al (37). The highest utility is developed by patients achieving the surgical resolution of their disease, while the lowest utility is developed by patients experiencing complications after failure or relapse of surgical management. Table II also reports the transition probabilities extrapolated by Jethwa et al (37) that were employed in the probabilistic tree used for the analysis.
Probabilistic tree
To perform the analysis, a probabilistic tree was structured based on the different therapeutic pathways and possible outcomes (Fig. 1). The costs and QALYs for each health state were incorporated into this model along with the probabilities of all the health states relevant to the intervention. Expected values for each branch of the probabilistic tree were derived by weighting costs and utility (QALYs) by the probability to fall in each of the possible pathways.
Sensitivity analysis
Both a one-way and probabilistic sensitivity analyses (PSA) were conducted to characterize the uncertainty surrounding the parameters and assess the robustness of the results. The drivers included in the analysis varied, assuming a range of uncertainty of ±20% from their base-case value (39). Results were graphically represented through a tornado diagram; only the parameters with the highest impact on costs were graphically represented.
The investigation also included the development of a multi-way PSA to test (performing 1,000 Monte Carlo simulations) the robustness of the cost-utility model considering the simultaneous variation of all the parameters in their range of uncertainty (39). Each category of parameters was associated with a specific statistic distribution (e.g., normal for frequency parameters, Beta for probabilities and utilities) (26). Cost inputs were not considered in the PSA analysis, as these are values not associated with uncertainty as established at the Italian NHS level. PSA results are graphically represented on a cost-effectiveness plane displaying the variability between cost and effectiveness outcomes.
The authors have also analyzed net monetary benefit (NMB) that was calculated by assigning a monetary value to the incremental benefit achieved (equal to the product of the cost-effectiveness ceiling ratio for one unit of benefit and the number of units of benefit achieved), and subtracting from this the incremental cost (26). The incremental net monetary benefit (INB) measures the difference in NMB between alternative interventions, a positive incremental NMB indicating that the intervention is cost-effective compared with the alternative at the given WTP threshold (26). In this case the cost to derive the benefit is less than the maximum amount that the decision-maker would be willing to pay for this benefit. A negative NMB implies that an intervention should be rejected, as its value is less than the additional cost of the benefit.
The calculation of the expected NMB and INB for each option across all iterations allowed for the definition of:
- the cost-effectiveness acceptability curve (CEAC) to compare the cost-effectiveness profile of the programs for varying values of the WTP;
- the cost-effectiveness acceptability frontier (CEAF) representing the probability that the optimal option is cost-effective at different WTP values;
- the expected value of perfect information (EVPI) curve determined, for a given WTP, by the difference between EVPI and the expected value with current information.
TABLE II - Transition probabilities employed in the probabilistic tree (37)

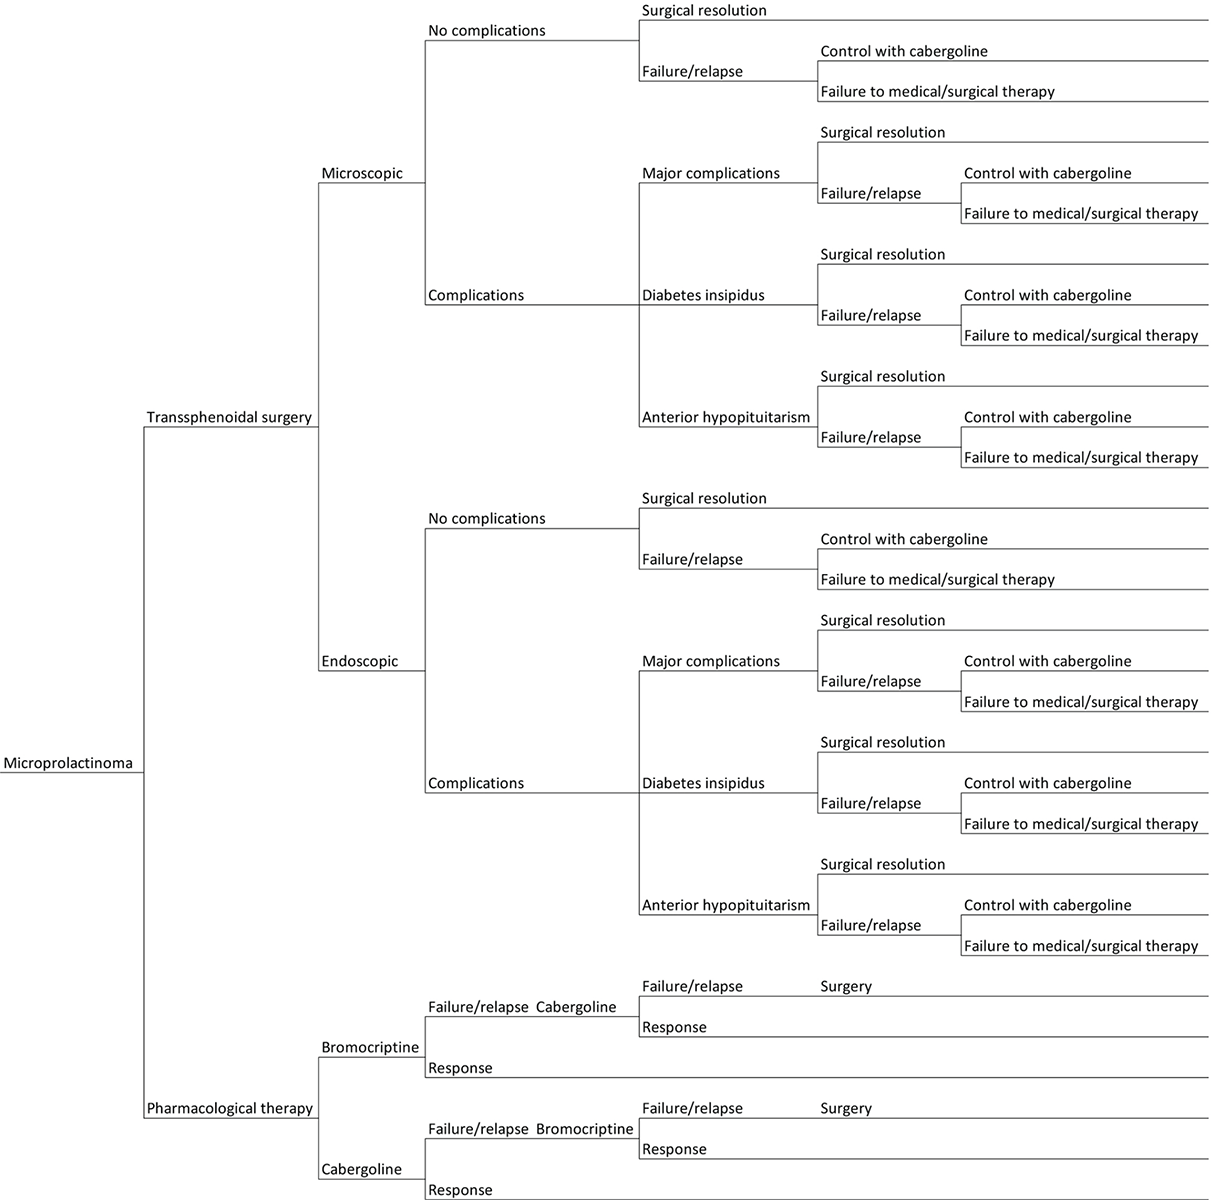
Fig. 1 - Graphical representation of the probabilistic tree based on the possible outcomes of the treatments under consideration for the management of microprolactinoma patients.
Results
Micro-costing analysis
Table III shows the results of the micro-costing analysis conducted. The total cost of the Cab approach in the first year is €1,586.04 and €2,267.46 in microP and MP, respectively. The cost item associated with the highest expense is that related to the exams/visits that the patient undergoes for the initial evaluation (€523.34 and €722.68 in microP and MP, respectively). Since the second to the fifth year of treatment, the annual cost amounts to €807.32 and €1,078.26 in the two subgroups, respectively, with the item related to the acquisition of pharmacological therapy being the one associated with the highest expense in microP (€296.77). These costs undergo a reduction since the fifth year after the beginning of therapy, settling at a cost of €765.59 and €967.74 in microP and MP, respectively (Supplementary Table 8-13).
| Microprolactinoma | Macroprolactinoma | |||||
|---|---|---|---|---|---|---|
| 1st year | Subsequent years (2-5) | Subsequent years (>5) | 1st year | Subsequent years (2-5) | Subsequent years (>5) | |
| Cabergoline | ||||||
| Pharmacological therapy | €417.33 | €296.77 | €296.77 | €612.09 | €370.96 | €370.96 |
| First visit | €523.34 | N/A | N/A | €722.68 | N/A | N/A |
| Follow-up | €388.78 | €253.96 | €212.22 | €676.09 | €450.70 | €340.18 |
| Indirect costs | €256.59 | €256.59 | €256.59 | €256.59 | €256.59 | €256.59 |
| Total | €1,586.04 | €807.32 | €765.59 | €2,267.46 | €1,078.26 | €967.74 |
| Bromocriptine | ||||||
| Pharmacological therapy | €101.54 | €72.91 | €72.91 | €169.81 | €141.18 | €141.18 |
| First visit | €470.45 | N/A | N/A | €541.89 | N/A | N/A |
| Follow-up | €300.50 | €137.19 | €109.41 | €667.92 | €339.23 | €209.49 |
| Indirect costs | €256.59 | €256.59 | €256.59 | €256.59 | €256.59 | €256.59 |
| Total | €1,129.09 | €466.69 | €438.91 | €1,636.21 | €737.00 | €607.26 |
| Temozolomide | ||||||
| Pharmacological therapy | N/A | N/A | N/A | €5,549.61 | N/A | N/A |
| First visit | N/A | N/A | N/A | €1,130.51 | N/A | N/A |
| Follow-up | N/A | N/A | N/A | €994.91 | €795.75 | €757.47 |
| Security check exams | N/A | N/A | N/A | €52.54 | N/A | N/A |
| Indirect costs | N/A | N/A | N/A | €256.59 | €256.59 | €256.59 |
| Total | N/A | N/A | N/A | €7,727.58 | €1,052.34 | €1,014.07 |
| Endoscopic surgery | ||||||
| Prehospitalization procedures | €498.60 | N/A | N/A | €498.60 | N/A | N/A |
| Intervention | €5,995.72 | N/A | N/A | €5,995.72 | N/A | N/A |
| Pharmacological therapy | €29.58 | N/A | N/A | €29.58 | N/A | N/A |
| Hospital stay | €3,273.71 | N/A | N/A | €3,273.71 | N/A | N/A |
| Healthcare professionals | €312.82 | N/A | N/A | €312.82 | N/A | N/A |
| Operating room | €2,159.50 | N/A | N/A | €2,159.50 | N/A | N/A |
| Postoperative checks | €220.11 | N/A | N/A | €220.11 | N/A | N/A |
| Surgical complications | €309.45 | €114.63 | €114.63 | €309.45 | €114.63 | €114.63 |
| Additional follow-up | €43.97 | N/A | N/A | €43.97 | N/A | N/A |
| Adjunctive drug therapy | €143.54 | €114.63 | €114.63 | €143.54 | €114.63 | €114.63 |
| Iatrogenic pathologies | €121.94 | N/A | N/A | €121.94 | N/A | N/A |
| Follow-up—1st month | €119.88 | N/A | N/A | €119.88 | N/A | N/A |
| Follow-up | €495.14 | €205.27 | €180.00 | €573.85 | €403.10 | €308.29 |
| Indirect costs | €1,399.95 | N/A | N/A | €1,399.95 | N/A | N/A |
| Patient | €1,314.51 | N/A | N/A | €1,314.51 | N/A | N/A |
| Caregivers | €85.44 | N/A | N/A | €85.44 | N/A | N/A |
| Total | €8,818.75 | €319.91 | €294.64 | €8,897.45 | €517.73 | €422.93 |
| Microscopic surgery | ||||||
| Prehospitalization procedures | €445.76 | N/A | N/A | €445.76 | N/A | N/A |
| Intervention | €6,227.72 | N/A | N/A | €6,227.72 | N/A | N/A |
| Pharmacological therapy | €29.58 | N/A | N/A | €29.58 | N/A | N/A |
| Hospital stay | €3,370.00 | N/A | N/A | €3,370.00 | N/A | N/A |
| Healthcare professionals | €310.44 | N/A | N/A | €310.44 | N/A | N/A |
| Operating room | €2,195.97 | N/A | N/A | €2,195.97 | N/A | N/A |
| Postoperative checks | €321.73 | N/A | N/A | €321.73 | N/A | N/A |
| Surgical complications | €236.17 | €54.20 | €54.20 | €236.17 | €54.20 | €54.20 |
| Additional follow-up | €46.80 | N/A | N/A | €46.80 | N/A | N/A |
| Adjunctive drug therapy | €67.43 | €54.20 | €54.20 | €67.43 | €54.20 | €54.20 |
| Iatrogenic pathologies | €121.94 | N/A | N/A | €121.94 | N/A | N/A |
| Follow-up—1st month | €119.88 | N/A | N/A | €119.88 | N/A | N/A |
| Follow-up | €583.46 | €270.44 | €262.76 | €588.94 | €392.77 | €330.32 |
| Indirect costs | €924.54 | N/A | N/A | €924.54 | N/A | N/A |
| Patient | €913.13 | N/A | N/A | €913.13 | N/A | N/A |
| Caregivers | €11.41 | N/A | N/A | €11.41 | N/A | N/A |
| Total | €8,537.54 | €324.64 | €316.96 | €8,543.01 | €446.97 | €384.52 |
| Radiation therapy | ||||||
| Intervention | €1,730.30 | N/A | N/A | €1,730.30 | N/A | N/A |
| Healthcare professionals | €1,210.58 | N/A | N/A | €1,210.58 | N/A | N/A |
| Materials | €101.04 | N/A | N/A | €101.04 | N/A | N/A |
| Structure | €418.68 | N/A | N/A | €418.68 | N/A | N/A |
| Follow-up | €695.06 | €615.72 | €538.76 | €695.06 | €615.72 | €538.76 |
| Indirect costs | €788.70 | €0.00 | €0.00 | €788.70 | €0.00 | €0.00 |
| Patient | €757.19 | N/A | N/A | €757.19 | N/A | N/A |
| Caregivers | €31.51 | N/A | N/A | €31.51 | N/A | N/A |
| Total | €3,214.06 | €615.72 | €538.76 | €3,214.06 | €615.72 | €538.76 |
As to the Br treatment, the total cost in the first year is €1,129.09 and €1,636.21 in microP and MP, respectively. The cost item associated with the highest expense is that related to the exams/visits that the patient undergoes for the initial evaluation (€470.45) in microP and to follow-up in MP (€667.92). Since the second to the fifth year of treatment, the annual cost amounts to €466.69 and €737.00 in the two subgroups, respectively, with indirect costs being those associated with the highest expense in microP (€256.59) and follow-up in MP (€339.23). These costs undergo a reduction since the fifth year after the beginning of therapy, settling at a cost of €438.91 and €607.26 in microP and MP, respectively (Supplementary Table 14-19).
The temozolomide treatment is characterized by a total cost of €7,727.58 in the first year. The cost item associated with the highest expense is the follow-up (exams/visits that the patient undergoes for the initial assessment, accounting for €1,130.51). Since the second to the fifth year of treatment, the annual cost amounts to €1,052.34, with follow-up costs being those associated with the highest expense (€795.75). The costs are characterized by a decreasing trend since the fifth year of treatment, settling at a cost of €1,014.07 (Supplementary Table 20-24).
As for endoscopic surgery interventions in microP and MP, as shown in Table III, the overall cost in the first year is €8,818.75 and €8,897.45, respectively. Hospital stay is cost item associated with the highest expense (€3,273.71). Since the second to the fifth year of treatment, the annual cost amounts to €319.91 and €517.73 in the two subgroups, respectively, with follow-up costs being those associated with the highest expense (€205.27 in microP and €403.10 in MP). These costs decrease since the fifth year of treatment, settling at €294.64 and €422.93 in microP and MP, respectively (Supplementary Table 25-35).
As to the microscopic surgery interventions in microP and MP, as shown in Table III, the overall cost in the first year is €8,818.75 and €8,897.45, respectively. The cost item associated with the highest expenditure is the intervention itself (€5,995.72). Since the second to the fifth year of treatment, the annual cost amounts to €319.91 and €517.73 in the two subgroups, respectively, follow-up costs being those associated with the highest expense (€205.27 in microP and €403.10 in MP). These costs undergo a reducing trend since the fifth year of therapy, settling at an expense of €294.64 and €422.93 in microP and MP, respectively (Supplementary Table 36-46).
Finally, as for the radiation therapy, Table III reports the various cost items analyzed for the provision of this strategy: the highest cost is associated with the intervention (€1,730.30), while the procedures related to follow-up have a less significant impact on the overall cost. The total cost of the radiation therapy amounted to €3,214.06, with annual follow-up costs of €615.72 between the second and the fifth year and €538.76 in subsequent years.
In general, the total cost for the first year of treatment ranges between €1,129.09 and €8,818.75 for microP and €2,267.46 and €8,897.45 for MP, depending on the treatment option. For subsequent years, the total costs range from €294.64 to €807.32 for microP and €422.93 to €1,078.26 for MP, depending on the treatment option and the number of years elapsed since diagnosis (Supplementary Table 47-50).
The contribution provided by the caregiver or family members was also considered (see Tab. III). The analysis showed that the average absorption of resources per patient with either microP or MP is in the first year equal to:
- Cab: €1,586.04 vs €2,267.46;
- Br: €1,129.09 vs €1,636.21;
- Temozolomide: not calculated in microP (inappropriate treatment) vs €7,738.80;
- Endoscopic surgery: €8,818.75 vs €8,897.45;
- Microscopic surgery: €8,506.63 vs €8,512.11;
- Radiation therapy: not calculated in microP (inappropriate treatment) vs €3,214.06.
As for the loss of patients and caregivers’ productivity, costs are €256.59 for pharmacological therapies, €1,399.95 and €924.54, respectively, for endoscopic and microscopic surgery, and €788.70 for irradiation. In the present analysis, costs related to the healthcare personnel (time dedicated to provision of treatments) may be interpreted as opportunity costs: these costs are sustained by the healthcare structure irrespective of the number of services provided; the analysis tried to allocate the share of such costs absorbed in the provision of the treatments under analysis. In other words, the personnel continue to receive salaries regardless of the choice to provide the analyzed service or not. These costs reflect the resources that could be redirected for other purposes within the healthcare system.
The analysis also investigated the recourse rates of the therapies under analysis (see Tab. IV): it emerged that the pharmacological therapy with Cab is the most used strategy (91.44%), while the treatment with the lowest rate of use is the microscopic surgery (0.86%). By weighing the total cost of the treatments by their recourse rates, it was possible to calculate the overall average cost of managing prolactinoma. For microP and MP, respectively, the average cost in the first year is €2,558.91 and €3,287.40, respectively. Patient’s monitoring in the period since the second to the fifth year is associated with an average annual cost of €798.13 and €1,084.59 in the two groups, respectively. These costs undergo a reduction trend since the fifth year after the beginning of the treatment, settling at €754.85 and €968.37 in microP and MP, respectively.
| Procedure | Recourse use | 1st year | Following years | |
|---|---|---|---|---|
| (2nd-5th) | (beyond 5th) | |||
| Microprolactinoma | ||||
| Cabergoline | 91.44% | €1,586.04 | €807.32 | €765.59 |
| Bromocriptine | 1.71% | €1,129.09 | €466.69 | €438.91 |
| Temozolomide | 0% | N/A | N/A | N/A |
| Endoscopic surgery | 10.63% | €8,818.75 | €319.91 | €294.64 |
| Microscopic surgery | 0.86% | €8,537.54 | €324.64 | €316.96 |
| Radiation | 0% | N/A | N/A | N/A |
| Total weighted cost | €2,558.91 | €798.13 | €754.85 | |
| Macroprolactinoma | ||||
| Cabergoline | 91.44% | €2,267.46 | €1,078.26 | €967.74 |
| Bromocriptine | 1.71% | €1,636.21 | €737.00 | €607.26 |
| Temozolomide | 1.14% | €7,738.80 | €1,052.34 | €1,014.07 |
| Endoscopic surgery | 10.63% | €8,897.45 | €517.73 | €422.93 |
| Microscopic surgery | 0.86% | €8,512.11 | €446.97 | €384.52 |
| Radiation | 2.46% | €3,214.06 | €615.72 | €538.76 |
| Total weighted cost | €3,287.53 | €1,084.59 | €968.37 | |
Cost-utility analysis
Table V presents the results of a CUA for different therapeutic actions, comparing their effectiveness in terms of QALYs gained and provision costs. The first row shows the results for the therapeutic strategy based on Br, with 0.7939 QALYs gained at a cost of €3,616.94. Br thus resulted in the alternative associated with the lowest achievable QALYs and costs, and was considered as the reference strategy to calculate the incremental cost-utility ratios. Cab is associated with 0.8628 QALYs gained at a cost of €3,837.39. It shows a difference (Δ) of 0.07 QALYs gained and an additional cost of €220.45 compared to Br. The ICER for Cab compared to Br is €3,201.15. Microscopic surgery is associated with 0.9656 QALYs gained at a cost of €8,589.85. It indicates an increase of 0.10 QALYs gained and an additional cost of €4,752.47 compared to Br. The ICER for microscopic surgery is €46,196.78. Endoscopic surgery allows to achieve 0.9725 QALYs at a cost of €8,759.85. It shows a slight increase of 0.01 QALYs and an additional cost of €169.99 compared to Br. The ICER for endoscopic surgery is thus equal to €24,680.91.
As microscopic surgery is extendedly dominated (26) by endoscopic surgery, the CUA compares the remaining three options (see Tab. VI), with the following incremental cost-utility ratios: Cab: €3,169.96; endoscopic surgery: €44,846.64.
| QALYs | Costs | ΔQALYs | ΔCosts | ICER | |
|---|---|---|---|---|---|
| Bromocriptine | 0.7939 | €3,616.94 | – | – | – |
| Cabergoline | 0.8628 | €3,837.39 | 0.07 | €220.45 | €3,201.15 |
| Microscopic surgery | 0.9656 | €8,589.85 | 0.10 | €4,752.47 | €46,196.78 |
| Endoscopic surgery | 0.9725 | €8,759.85 | 0.01 | €169.99 | €24,680.91 |
ICER = incremental cost-effectiveness ratio; QALY = quality-adjusted life year.
| QALYs | Costs | ΔQALYs | ΔCosts | ICER | |
|---|---|---|---|---|---|
| Bromocriptine | 0.7939 | €3,616.94 | – | – | – |
| Cabergoline | 0.8628 | €3,837.39 | 0.07 | €220.45 | €3,201.15 |
| Endoscopic surgery | 0.9725 | €8,759.85 | 0.11 | €4,922.46 | €44,846.64 |
ICER = incremental cost-effectiveness ratio; QALY = quality-adjusted life year.
Considering a WTP of €40,000/QALY (38), the baseline findings show Cab to have high cost utility and endoscopic surgery just a tad above that.
One-way sensitivity analysis
Figure 2A shows the results of the one-way sensitivity analysis (OWSA) between Cab and Br treatment. The parameter whose variation mostly affects the base-case results is the utility associated with the remission health state in patients treated with Br: when decreasing the value of this parameter, Cab becomes strongly dominant (less costly and more effective) as compared to Br (ICER to −€163.92). Conversely, when the absolute value of this parameter increases, the baseline ICER equals €6,439.36, reducing the cost-effectiveness profile of Br. The second parameter with a significant impact on the base-case results is the probability of remission on Cab treatment. When this parameter was set at its lower bound, the ICER increased to €7,004.33. Conversely, setting it at the upper bound yielded a decrease in ICER to €1,054.49.
Figure 2B presents the OWSA comparing endoscopic surgery with Cab. The parameter that has the most significant impact on the base-case results is the utility associated with surgical cure: when this parameter is at its lower bound, the ICER decreased to −€68,598.10. In this scenario, endoscopic surgery is dominated (costlier and less effective). Being “1” the base case and the maximum value for this parameter, the graph only considers a decreasing variation and thus represents only one arm. The second parameter with a significant impact on the base-case results is the probability of cure after endoscopic surgery. When this parameter was set at its lower bound, the ICER increased to €91,049.15. Conversely, setting it at the upper bound yielded a decrease in ICER to €35,658.48.
Probabilistic sensitivity analysis
The results of the 1,000 simulations performed were presented on a cost-effectiveness plan, where each point corresponds to a different simulation of the model during PSA. The cost-effectiveness plan highlights the variation from the base-case results.
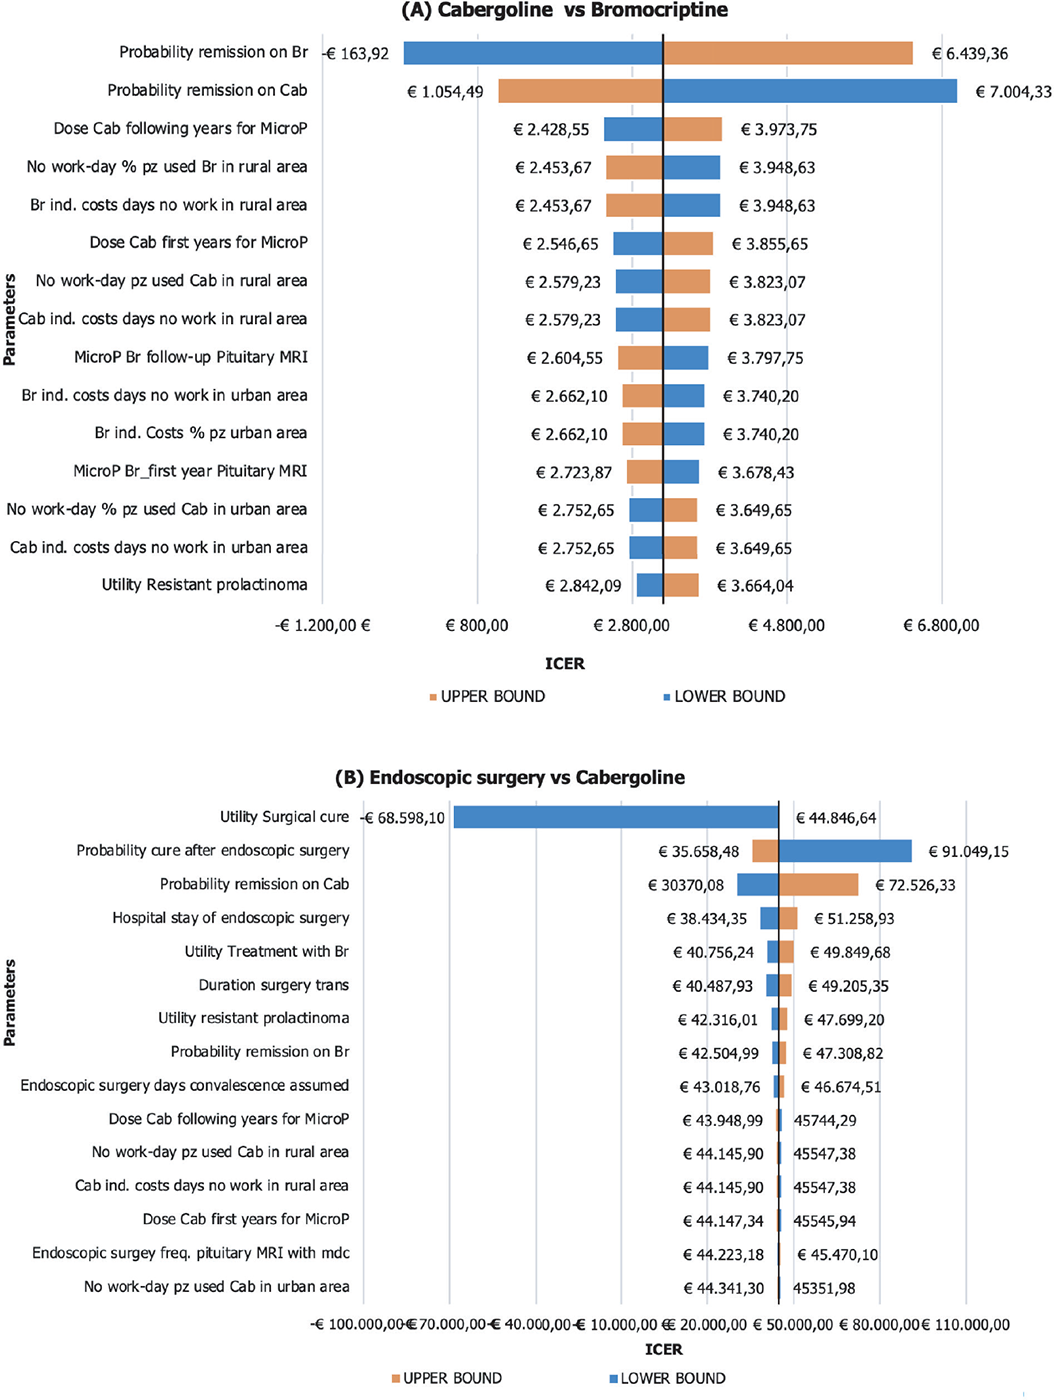
Fig. 2 - One-way sensitivity analysis: A) Cabergoline vs bromocriptine; B) endoscopic surgery vs cabergoline. ICER = incremental cost-effectiveness ratio; MRI = magnetic resonance imaging.
Figure 3 reports the results of cost-effectiveness plan for the comparison between Cab and Br and endoscopic surgery and Cab.
Table VII reports the percentages of simulations falling in each region of cost-effectiveness plane. The simulations from the PSA based on the comparison of Cab and Br revealed the following outcomes: in 24.80% of the simulations, Cab dominated Br, indicating its superior effectiveness and lower costs. Additionally, there are 28.20% of simulations where Cab was cost-saving or dominated compared to Br. In 32.80% of the simulations, Br was neither cost-effective nor cost-saving compared to Cab. In 2.30% of the simulations, Cab is not cost-effective (more effective and costly than the alternative but above the WTP threshold). Lastly, in 11.90% of the simulations, Cab is less effective and costly than Br. In summary, the PSA results indicate that Cab is generally more cost-effective than Br, with a considerable proportion of simulations showing Cab as dominant or cost-effective.
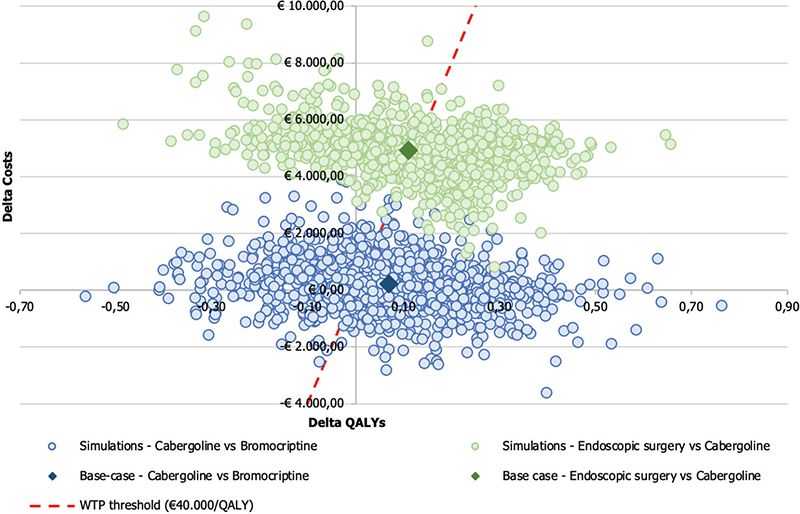
Fig. 3 - Results of probabilistic sensitivity analysis: comparing cabergoline vs bromocriptine and endoscopic surgery vs cabergoline. QALY = quality-adjusted life year; WTP = willingness-to-pay.
| % ICER Cab vs Br | % ICER End vs Cab | |
|---|---|---|
| NW—Dominated | 24.80% | 23.30% |
| SE—Cost-saving | 28.20% | 0.00% |
| NE—Cost-effective | 32.80% | 51.50% |
| NE—Not cost-effective | 2.30% | 25.20% |
| SW—Trade-off | 11.90% | 0.00% |
| Check | 100.00% | 100.00% |
Br = bromocriptine; Cab = cabergoline; End = endoscopic surgery; ICER = incremental cost-effectiveness ratio; NE= North East; NW = North West; SE = South East; SW = South West.
The simulations performed in the comparison between endoscopic surgery and Cab yielded the following outcomes: in 23.30% of the simulations, endoscopic surgery was dominated by Cab, indicating that endoscopic surgery is both more effective and less costly than Cab. However, in 51.50% of the simulations, endoscopic surgery was cost-effective compared to Cab, suggesting that it may provide sufficient benefits to justify its higher costs in the majority of the scenarios. Notably, there were no simulations demonstrating endoscopic surgery as cost-saving.
In 25.20% of the simulations, endoscopic surgery is not cost-effective compared to Cab. These findings emphasize that endoscopic surgery appears to be the more favorable option in terms of cost-effectiveness, while Cab may not offer a cost-effective alternative in most scenarios evaluated by the PSA.
The average modeled NMB from the comparison between Cab and Br was €2,232.87 considering a WTP threshold of €40,000/QALY. In contrast, for the comparison between endoscopic surgery and Cab, the NMB was negative and equal to −€434.20.
The results were also expressed in terms of CEAC to determine the probability for the surgical strategies to be cost-effective for varying values of the WTPs per QALY gained, including the baseline €40,000/QALY acceptability threshold. The CEAC (Fig. 4) shows the probability that each alternative remains cost-effective for varying values of the WTP. The INB of Cab vs Br demonstrates that ~62.30% of the PSA simulations fall within the acceptable range of €40,000. On the other hand, for endoscopic surgery vs Cab, the analysis shows that ~51.60% of the simulations fall within the acceptable range. This indicates a high probability for Cab to be cost-effective, as Cab and endoscopic surgery fall within the acceptable threshold of cost-effectiveness.
Figure 5 illustrates the Cost-effectiveness acceptability frontier (CEAF) determined from the comparisons previously shown in Figure 4. In the Cab vs Br comparison, the CEAF is at 62.5%, indicating that Cab is cost-effective vs Br up to a WTP threshold of €71,000.
On the other hand, in the comparison between endoscopic surgery vs Cab, the frontier is at 62.7%, suggesting that endoscopic surgery is even closer to being considered cost-effective compared to the previous alternatives considering a WTP threshold over €71,000.
In this case, the EVPI is €4,301.99 per patient, indicating that it would be convenient to spend up to this amount to gather further information to reduce uncertainty and obtain perfect information about the decision assuming a WTP threshold of €40,000/QALY.
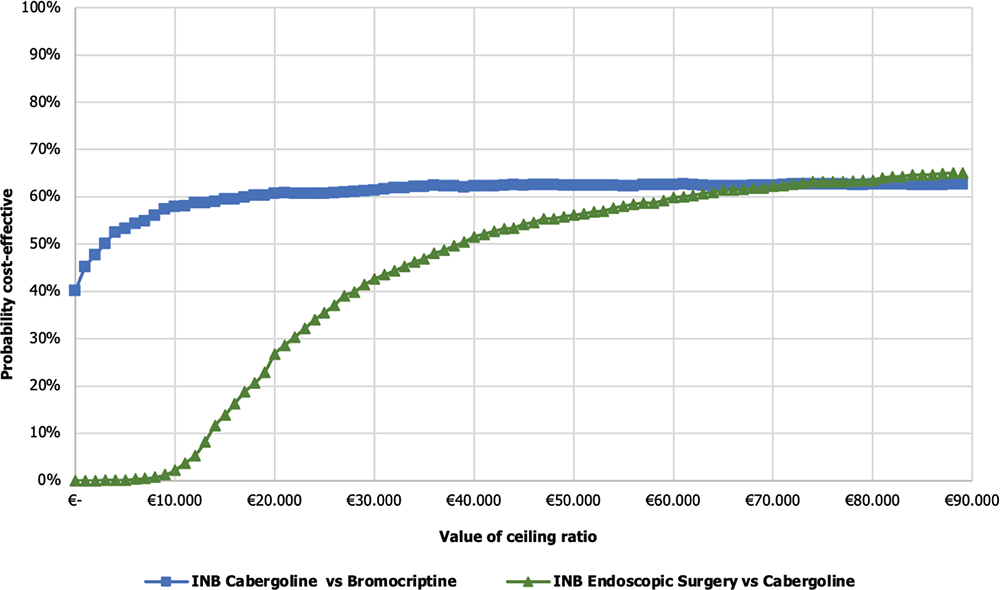
Fig. 4 - Cost-effectiveness acceptability curve of cabergoline vs bromocriptine and endoscopic surgery vs cabergoline. INB = incremental net monetary benefit.
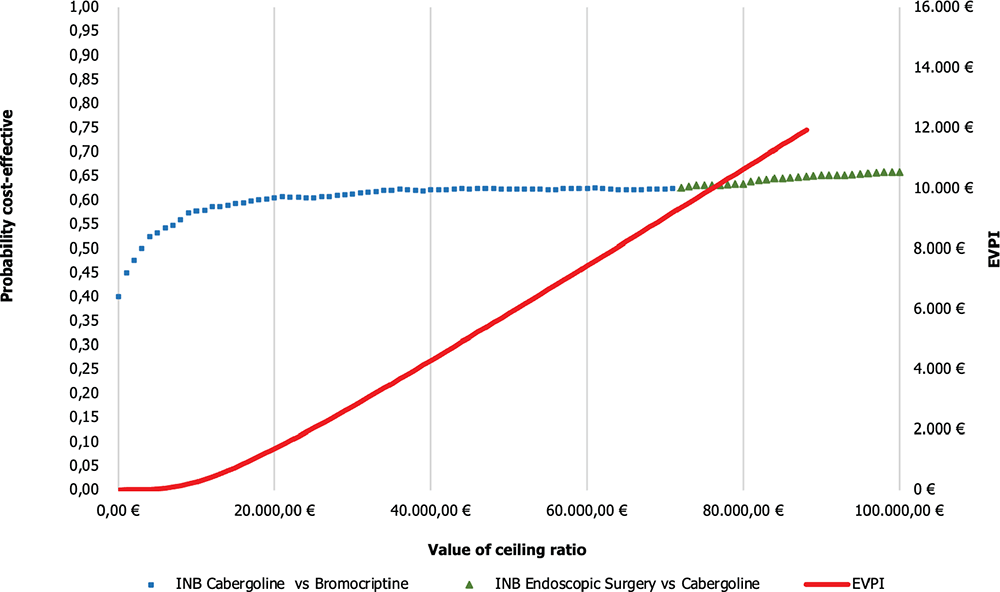
Fig. 5 - CEAF and EVPI of cabergoline vs bromocriptine and endoscopic surgery vs cabergoline. EVPI = expected value of perfect information; INB = incremental net monetary benefit.
Discussion
Since the late 1970s, pharmacological therapy with DAs has become the established standard of care for prolactinomas due to their proven effectiveness in reducing hormone secretion and tumor size. DAs have been used successfully in the majority of prolactinoma cases, while neurosurgery was progressively restricted to a minority of patients, namely those intolerant or resistant to pharmacological therapy and characterized by aggressive tumors (9).
In recent years, the technical progress in surgical procedures resulted in a significant improvement in neurosurgical outcomes that was paralleled by the decrease of adverse events’ rates. Currently, neurosurgery can be considered as an initial treatment also for non-aggressive prolactinomas. Surgical indications were extended, in cases where patients who are unwilling to undergo a long-term drug therapy, to micro- and macro-adenomas as well (18,19. In these cases, surgical treatments are appreciated by patients (40) and mostly characterized by a favorable sustainability profile (37).
At the best possible accuracy level, the study assessed the costs associated with either the pharmacological or surgical interventions for patients affected by microP or MP. The results of a survey among a panel of clinicians with proven clinical experience operating in the Italian healthcare setting were used for this scope. The survey investigated about the drugs, tests, visits, and health professionals involved in the provision process of the treatments under analysis.
The CUA by Jethwa et al (37) for the subgroup of patients with microP was adapted to the Italian healthcare setting. Cab resulted as a more cost-effective treatment than Br, with an ICER of €3,201.15/QALY. Furthermore, when comparing surgical options, microscopic surgery was found to be dominated by endoscopic surgery, indicating that endoscopic surgery provides better outcomes at a lower cost. Regarding the ICER for endoscopic surgery, it was estimated to be €44,846.64, representing the additional cost per QALY gained compared to Cab treatment. The baseline findings reveal that endoscopic surgery is just slightly above the WTP threshold of €40,000/QALY in the reference economy (38), while Cab proves to have high cost utility. These updated results provide valuable insights for decision-makers in choosing the most efficient treatment options for patients with microP. The findings highlight the importance of considering both clinical outcomes and costs to optimize healthcare resource allocation and improve patient outcomes.
Large-scale implementation of a shift from DA to surgery as the first-line approach for prolactinomas deserves a few comments. The favorable results reported in the literature were obtained in centers of excellence that are not easily accessible from all areas of the country. A pituitary neurosurgeon with specific expertise is requested to perform at least 50 pituitary surgeries per year and work in a multidisciplinary pituitary team (41). The working group should include an endocrinologist and a neuroradiologist but the participation of a neuro-ophthalmologist, a neuro-oncologist, a radiotherapist, and a pathologist is advisable as well.
Based on these considerations, two management scenarios can be foreseen in the medium term. Patients may be addressed to centers with lower experience, at the cost of obtaining suboptimal results or, alternatively, to centers of excellence, thus resulting in delayed admission times and overdue interventions, in the case of pituitary diseases that need a rapid action, such as severe hypercortisolism due to adrenocorticotropic hormone (ACTH)-secreting adenomas and tumors abutting optical pathways.
Unfortunately, an “official” report of transsphenoidal surgeries performed each year in Italy is not available, because the diagnosis-related group (DRG) coded as 286 includes both adrenal and pituitary surgeries (3,190 in 2019 according to the 2020 annual report of the Italian Ministry of Health). Regional health departments were required to provide these data but only three regions satisfied the requests (Lombardy, Veneto, and Emilia-Romagna). The population of those three regions accounts for approximately one-third of the total Italian population. By adding up the number of operations performed in these regions in 2019 (before the drastic drop due to COVID-19 pandemic) and using an arbitrary correction factor to adjust for their higher pull effect for patients living elsewhere (thus multiplying the total for 2.7 instead of 3), the total annual figure of transsphenoidal surgeries performed in Italy can be estimated to be around 2,400. This would represent three-fourths of the real total of adrenal and pituitary operations officially reported, which is a reliable fraction.
Presently, 5%-10% of pituitary surgeries in Italy are performed for prolactinomas. The number of operations performed with curative intent is widely variable between Italian healthcare structures, but it can be arbitrarily assumed that 90% of prolactinomas are operated upon for optical pathway compression, for aggressive growth, or for resistance to medical therapy. We postulate that the implementation of this GL might result in an increase in the annual number of surgeries performed as first-line treatment for prolactinomas.
The cost increment for each neurosurgical intervention replacing long-term DA therapy for microP can be estimated at €3,938 over 10 years. This increased expenditure is due to the difference between the €12,581 average cost of endoscopic neurosurgery and the €8,643 average cost of Cab therapy. These two estimates were obtained by adding the first-year cost of treatment to the annual costs from the second to the fifth year, multiplied by 4, plus the annual cost after the fifth year, multiplied by 5. The corresponding estimate for MP is €1,664 that represents the difference between the €13,083 average cost of endoscopic neurosurgery and the €11,419 average cost of Cab therapy. Accordingly, the estimated excess raw cost for Italian NHS could initially range from €1,600 to €12,000 per year. Thus, if the proportion of prolactinoma patients undergoing neurosurgery as first-line treatment would increase by 10% yearly (a conservative and arbitrary fraction), the NHS excess cost could rise to €7,000-32,000 in a three-year period.
In Italy, the reimbursement for any service in public health structures is established by regulatory authorities. Transsphenoidal adenomectomy surgery (ICD9-CM 07.6 and 07.7) results in the maximum reimbursement of €7,695 for ordinary hospitalization but does not consider costs related to long-term follow-up. By applying the costs applied by the Italian NHS and taking into account the expected additional costs in the first year for the complementary services, the total expenditure can be established. For microP the €5,596 amount calculated for the net cost of the intervention should be subtracted from the €8,819 total cost for the first-year management. Then, the €7,695 sum of the NHS reimbursement should be added, so bringing the total cost over 10 years to €13,680. Similarly, for MP the €8,897 total estimated cost for the first year should be subtracted by the €5,596 cost calculated for the operation. Then, the €7,695 sum of the NHS reimbursement should be added, so bringing the total sum over 10 years to €15,182. The difference between the two figures is, respectively, €5,037 and €3,763 for the adenomectomy of microP and MP. Therefore, the rounded estimate of the increase in annual costs for the NHS foresees a range from €4,000 to €20,000 (10% increase in elective interventions) to €16,000 to €40,000 (30% increase in elective interventions).
Though a conclusive estimate of the variation of annual expenses cannot be performed, the cost-efficacy analysis appears in favor of Cab therapies.
Study limitations
The present study has several limitations that should be acknowledged. Firstly, due to the absence of literature specifically addressing the management of patients with prolactinomas in the Italian context, a survey was conducted to gather relevant data. While this survey provided valuable information, it may not capture all the nuances and complexities of the Italian healthcare system. The results achieved are thus not generalizable.
Another limitation is that many of the values used in the model are based on a cost-effectiveness analysis conducted in the United States, which may not be directly translated to the Italian setting. Assumptions had to be made to fill in the gaps where numerical values or ranges were unavailable, such as assigning QALYs to different outcomes. Although efforts were made to create the best estimation, the model may not perfectly reflect the real-world scenario.
Other limitations include the fluctuation of prices for surgical devices, which can impact the overall costs. The risk of surgical complications and related costs is likely to be higher in real practice compared to the rates reported by specialized centers, where outcomes may be more optimized.
There might also be an overestimation of costs associated with surgical procedures due to the assumption of a similar follow-up intensity for pharmacological treatments and surgical alternatives. The recurrence rate of prolactinomas after surgical remission is low (42), suggesting that postsurgical follow-up may be less intense compared to the pharmacological therapy.
The costs of replacement therapies and follow-up resulting from surgery-induced hypopituitarism are additional factors that could impact the overall cost analysis.
Another limitation needs to be considered, that is, the costs associated with the healthcare professionals for surgical interventions, including the time imputable to pauses between operations and nonsurgical times: this includes activities such as dressing and undressing procedures, patient information, obtaining informed consent, operating room cleaning, and monitoring patients during the weaning process from anesthesia.
Lastly, the study includes the potential overestimation of the costs of informal care due to the assumption that patients’ relatives substitute working hours and the exclusion of out-of-pocket expenses, as the information was solely derived from healthcare providers, who could provide only partial information regarding patients’ and caregivers’ productivity losses related to the absence of patients and their carers from work.
As a result, some assumptions needed to be made to complete the model. Although this model may not be a perfect reflection of the real world, it represents an attempt to make the best estimation considering the available evidence and data limitations. Future research should aim to address these limitations and provide more accurate and context-specific data for cost analyses in the management of prolactinomas in the Italian healthcare system.
Conclusions
The surgical treatments considered in the analysis are characterized by a favorable cost-utility profile as compared to the pharmacological approaches. It is thus desirable in the future to witness a rise in the recourse to surgery as a first-line treatment for prolactinomas. This strategy could provide improved outcomes for the patients together with a more appropriate allocation of healthcare resources.
Further research and data collection should be realized to fill the existing gap in the scientific literature, to gain a more accurate understanding of the economic impact of different management strategies for prolactinomas within the Italian healthcare system as by continuously evaluating and refining cost-effectiveness analyses, healthcare providers and policymakers can make informed decisions to optimize patient care and resource allocation in the management of prolactinomas.
Disclosures
Conflicts of interest: The authors and the members of the panel declare no potential conflict of interest to be disclosed.
Financial support: Financial support for this study was provided by Associazione Medici Endocrinologi (AME).
References
- 1. Chanson P, Maiter D. The epidemiology, diagnosis and treatment of prolactinomas: the old and the new. Best Pract Res Clin Endocrinol Metab. 2019;33(2):101290. CrossRef PubMed
- 2. Vroonen L, Daly AF, Beckers A. Epidemiology and management challenges in prolactinomas. Neuroendocrinology. 2019;109(1):20-27. CrossRef PubMed
- 3. Olarescu NC, Perez-Rivas LG, Gatto F, et al; EYRC (ENEA Young Researcher Committee). Aggressive and Malignant Prolactinomas. Neuroendocrinology. 2019;109(1):57-69. CrossRef PubMed
- 4. de Laat JM, Dekkers OM, Pieterman CR, et al. Long-term natural course of pituitary tumors in patients with MEN1: results from the Dutch MEN1 study group (DMSG). J Clin Endocrinol Metab. 2015;100(9):3288-3296. CrossRef PubMed
- 5. Daly AF, Tichomirowa MA, Petrossians P, et al. Clinical characteristics and therapeutic responses in patients with germ-line AIP mutations and pituitary adenomas: an international collaborative study. J Clin Endocrinol Metab. 2010;95(11):E373-E383. CrossRef PubMed
- 6. Soto-Pedre E, Newey PJ, Bevan JS, Leese GP. Morbidity and mortality in patients with hyperprolactinaemia: the PROLEARS study. Endocr Connect. 2017;6(8):580-588. CrossRef PubMed
- 7. Iannone P, Coclite D, Fauci AJ, Graziano G, Napoletano AM. [Italian guidelines in accordance with the new National Guidelines System: critical issues and perspectives]. Recenti Prog Med. 2017;108(9):360-362. CrossRef PubMed
- 8. Morgano GP, Parmelli E, Amato L, et al. [GRADE Evidence to Decision (EtD) frameworks: a systematic and transparent approach to making well informed healthcare choices. 2: Clinical practice guidelines]. Recenti Prog Med. 2018;109(5):272-293. CrossRef PubMed
- 9. Melmed S, Casanueva FF, Hoffman AR, et al; Endocrine Society. Diagnosis and treatment of hyperprolactinemia: an Endocrine Society clinical practice guideline. J Clin Endocrinol Metab. 2011;96(2):273-288. CrossRef PubMed
- 10. Sistema Nazionale Linee Guida dell’Istituto Superiore di Sanità. Terapia dei prolattinomi. 2022. Online (Accessed April 2023)
- 11. Verhelst J, Abs R, Maiter D, et al. Cabergoline in the treatment of hyperprolactinemia: a study in 455 patients. J Clin Endocrinol Metab. 1999;84(7):2518-2522. CrossRef PubMed
- 12. Colao A, Di Sarno A, Landi ML, et al. Macroprolactinoma shrinkage during cabergoline treatment is greater in naive patients than in patients pretreated with other dopamine agonists: a prospective study in 110 patients. J Clin Endocrinol Metab. 2000;85(6):2247-2252. CrossRef PubMed
- 13. Casanueva FF, Molitch ME, Schlechte JA, et al. Guidelines of the Pituitary Society for the diagnosis and management of prolactinomas. Clin Endocrinol (Oxf). 2006;65(2):265-273. CrossRef PubMed
- 14. Cozzi R, Ambrosio MR, Attanasio R, et al. Italian Association of Clinical Endocrinologists (AME) and International Chapter of Clinical Endocrinology (ICCE). Position statement for clinical practice: prolactin-secreting tumors. Eur J Endocrinol. 2022;186(3):1-P33. CrossRef PubMed
- 15. Molitch ME. Dopamine resistance of prolactinomas. Pituitary. 2003;6(1):19-27. CrossRef PubMed
- 16. Maiter D. Management of dopamine agonist-resistant prolactinoma. Neuroendocrinology. 2019;109(1):42-50. CrossRef PubMed
- 17. Colao A, Di Sarno A, Cappabianca P, Di Somma C, Pivonello R, Lombardi G. Withdrawal of long-term cabergoline therapy for tumoral and nontumoral hyperprolactinemia. N Engl J Med. 2003;349(21):2023-2033. CrossRef PubMed
- 18. Zamanipoor Najafabadi AH, Zandbergen IM, de Vries F, et al. Surgery as a viable alternative first-line treatment for prolactinoma patients. A systematic review and meta-analysis. J Clin Endocrinol Metab. 2020;105(3):e32-e41. CrossRef PubMed
- 19. Tampourlou M, Trifanescu R, Paluzzi A, Ahmed SK, Karavitaki N. Therapy of endocrine disease: surgery in microprolactinomas: effectiveness and risks based on contemporary literature. Eur J Endocrinol. 2016;175(3):R89-R96. CrossRef PubMed
- 20. Roelfsema F, Biermasz NR, Pereira AM. Clinical factors involved in the recurrence of pituitary adenomas after surgical remission: a structured review and meta-analysis. Pituitary. 2012;15(1):71-83. CrossRef PubMed
- 21. Primeau V, Raftopoulos C, Maiter D. Outcomes of transsphenoidal surgery in prolactinomas: improvement of hormonal control in dopamine agonist-resistant patients. Eur J Endocrinol. 2012;166(5):779-786. CrossRef PubMed
- 22. Sheplan Olsen LJ, Robles Irizarry L, Chao ST, et al. Radiotherapy for prolactin-secreting pituitary tumors. Pituitary. 2012;15(2):135-145. CrossRef PubMed
- 23. Hung YC, Lee CC, Yang HC, et al. The benefit and risk of stereotactic radiosurgery for prolactinomas: an international multicenter cohort study. J Neurosurg. 2019;133(3):1-10. CrossRef PubMed
- 24. Trouillas J, Delgrange E, Wierinckx A, et al. Clinical, pathological, and molecular factors of aggressiveness in lactotroph tumours. Neuroendocrinology. 2019;109(1):70-76. CrossRef PubMed
- 25. McCormack A, Dekkers OM, Petersenn S, et al; ESE Survey Collaborators. Treatment of aggressive pituitary tumours and carcinomas: results of a European Society of Endocrinology (ESE) survey 2016. Eur J Endocrinol. 2018;178(3):265-276. CrossRef PubMed
- 26. Drummond MF, Sculpher MJ, Claxton K, et al. Methods for the economic evaluation of health care programmes. 4th ed. Oxford University Press; 2015:253-255.
- 27. Perazzo H, Jorge MJ, Silva JC, et al. Micro-costing analysis of guideline-based treatment by direct-acting agents: the real-life case of hepatitis C management in Brazil. BMC Gastroenterol. 2017;17(1):119. CrossRef PubMed
- 28. Edwards RT, Céilleachair A, Bywater T, Hughes DA, Hutchings J. Parenting programme for parents of children at risk of developing conduct disorder: cost effectiveness analysis. BMJ. 2007;334(7595):682. CrossRef PubMed
- 29. Griffith GL, Edwards RT, Gray J, et al. Estimating the survival benefits gained from providing national cancer genetic services to women with a family history of breast cancer. Br J Cancer. 2004;90(10):1912-1919. CrossRef PubMed
- 30. Kinsella S. Ten lessons for micro-costing in health economics. Department of Economics, Kemmy Business School, University of Limerick; 2008.
- 31. Morris S, Devlin N, Parkin D, Spencer A. Economic analysis in healthcare. John Wiley & Sons; 2012.
- 32. Fattore G. Proposta di Linee Guida per la valutazione economica degli interventi sanitari in Italia. PharmacoEcon Ital Res Artic. 2009;11(2):83-93. CrossRef
- 33. Ministero della Salute M. Tariffario delle Prestazioni Specialistiche Ambulatoriali. Online Accessed July 2023.
- 34. Agenzia per la Rappresentanza Negoziale delle Pubbliche Amministrazioni (ARAN). Online Accessed July 2023.
- 35. Agenzia Italiana del Farmaco (AIFA). Lista di Trasparenza AIFA, Farmaci di Fascia H. Online Accessed July 2023.
- 36. Agenzia Italiana del Farmaco (AIFA). Lista di Trasparenza AIFA, Farmaci di Fascia A. Online Accessed July 2023.
- 37. Jethwa PR, Patel TD, Hajart AF, Eloy JA, Couldwell WT, Liu JK. Cost-effectiveness analysis of microscopic and endoscopic transsphenoidal surgery versus medical therapy in the management of microprolactinoma in the United States. World Neurosurg. 2016;87:65-76. CrossRef PubMed
- 38. Russo P, Zanuzzi M, Carletto A, Sammarco A, Romano F, Manca A. Role of economic evaluations on pricing of medicines reimbursed by the Italian National Health Service. PharmacoEconomics. 2023;41(1):107-117. CrossRef PubMed
- 39. Gray AM, Clarke PM, Wolstenholme JL, Wordsworth S. Applied methods of cost-effectiveness analysis in healthcare. Vol 3. Oxford: OUP; 2010.
- 40. Baussart B, Villa C, Jouinot A, et al. Pituitary surgery as alternative to dopamine agonists treatment for microprolactinomas: a cohort study. Eur J Endocrinol. 2021;185(6):783-791. CrossRef PubMed
- 41. Casanueva FF, Barkan AL, Buchfelder M, et al; Pituitary Society, Expert Group on Pituitary Tumors. Criteria for the definition of Pituitary Tumor Centers of Excellence (PTCOE): A Pituitary Society Statement. Pituitary. 2017;20(5):489-498. CrossRef PubMed
- 42. Losa M, Mortini P, Barzaghi R, Gioia L, Giovanelli M. Surgical treatment of prolactin-secreting pituitary adenomas: early results and long-term outcome. J Clin Endocrinol Metab. 2002;87(7):3180-3186. CrossRef PubMed