|
Glob Reg Health Technol Assess 2021; 8: 58-66 ISSN 2283-5733 | DOI: 10.33393/grhta.2021.2183 ORIGINAL RESEARCH ARTICLE |
Clinical and economic benefits of a new paradigm of HCV diagnosis and treatment
ABSTRACT
Introduction: The current paradigm (CP) of hepatitis C virus (HCV) diagnosis and treatment in Italy’s National Health Service system has numerous steps. The European Association for the Study of the Liver recommends initiation of a pan-genotypic direct-acting antiviral regimen after a simple diagnostic process. The present study estimated the efficiency gains resulting from two simplified pathways from diagnosis to treatment of chronic hepatitis C patients in Italy over the next 5 years from a societal perspective.
Methods: The CP, a New Paradigm 1 (NP1), and a New Paradigm 2 (NP2) were evaluated in a Markov model. The NP1 model simplifies monitoring and laboratory test requirements in the diagnosis and treatment phases. The NP2 model also eliminates the primary care referral requirement.
Results: Treatment process time for non-cirrhotic patients was 48, 43, and 25 weeks in the CP, NP1, and NP2, respectively, and in cirrhotic patients was 49, 46, and 37 weeks. Under the CP, 19% of patients/year would be lost to follow-up, which decreases by 11% in NP1 and 100% in NP2. Compared with the CP, implementation of NP1 at 5 years would reduce compensated cirrhosis, decompensated cirrhosis, hepatocellular carcinoma, and liver-related deaths by 12.6%, 12.4%, 8.1%, and 8.8%, respectively; these cases would be reduced by 94.0%, 93.8%, 61.0%, and 58.4% in NP2. Total 5-year costs with the CP, NP1, and NP2 are estimated at 135.6€ million, 110.5€ million, and 80.5€ million, respectively.
Conclusions: Simplification of HCV diagnosis and monitoring requirements would allow Italy to move closer to international guidelines with significant health benefits and economic gains.
Keywords: Cost, Hepatitis C virus, Liver disease, Retention, Simplification
Received: September 14, 2020
Accepted: February 15, 2021
Published online: April 15, 2021
This article includes supplementary material
Global & Regional Health Technology Assessment - ISSN 2283-5733 - www.aboutscience.eu/grhta
© 2021 The Authors. This article is published by AboutScience and licensed under Creative Commons Attribution-NonCommercial 4.0 International (CC BY-NC 4.0).
Commercial use is not permitted and is subject to Publisher’s permissions. Full information is available at www.aboutscience.eu
Introduction
The Polaris Observatory HCV Collaborators modeling-based estimates indicate that, in 2015, there were 71 million people around the world infected with hepatitis C virus (HCV), approximately 680,000 of whom were in Italy (1). Since then, improvements in treatment have allowed for many patients being treated, and the latest estimates indicate that the number of diagnosed ill patients who have yet to be treated in Italy is around 240,000 (range: 192,035 to 311,793) (2).
Of the six genotypic HCV variants, the most common variant in Italy is 1b, which is the most aggressive variant (1). If untreated, HCV infection can lead to chronic hepatitis C (CHC) and may progress to advanced liver disease including compensated cirrhosis (CC), decompensated cirrhosis (DC), and hepatocellular carcinoma (HCC). CHC can place a tremendous burden on patients, with reduced health-related quality of life and increased work absenteeism and work impairment compared with those without HCV (3). There is also an increased healthcare burden with HCV. Patients with HCV report significantly more physician visits and emergency department visits compared with individuals without HCV (3).
The goal of HCV treatment is to cure the infection as demonstrated by a sustained virologic response (SVR) defined as undetectable serum or plasma HCV RNA at 12 weeks post end of treatment (4). Treatment for HCV has evolved from pegylated interferon and ribavirin treatments with SVR rates of approximately 50% to the development of direct-acting antivirals (DAA) with SVR rates of approximately 96% (5). The DAA combinations sofosbuvir/velpatasvir and glecaprevir/pibrentasvir are pan-genotypic, meaning they are effective for all of the HCV genotypes. Availability of these highly effective, well-tolerated, and pan-genotypic DAA combinations allowed the European Association for the Study of the Liver (EASL) to recommend a universal 12-week DAA combination regimen in patients without cirrhosis or with CC (4). Initiation of this universal regimen requires only the demonstration of HCV replication and assessment of cirrhotic status, without the need for genotyping (4).
The Italian National Health Service (NHS) has a reimbursement system that allows patients with HCV to receive free treatment, but the current HCV diagnosis and treatment pathway has numerous steps. The recommendations for a simplified diagnostic and treatment pathway with a universal pan-genotypic DAA regimen could result in more patients initiating and retaining care, which could lead to reductions in advance liver disease cases. Furthermore, eliminating some of the currently required diagnostic steps to align with the simplified EASL diagnostic process could result in cost savings for the NHS. The aim of the present study is to estimate the theoretical efficiency gains resulting from two simplified pathways from diagnosis to treatment of CHC patients in Italy taking into consideration the current treatment landscape and the population to be treated in the next 5 years from a societal perspective.
Materials and methods
Model overview
A series of linked Markov models were developed to estimate the health outcomes and cost differences resulting from simplifying the treatment pathway for CHC patients in Italy (Fig. 1). Three different paradigms are modeled (Tabs. I and II), the current paradigm (CP), a New Paradigm 1 (NP1), and a New Paradigm 2 (NP2). In the CP, patients must undergo several steps from diagnosis to treatment. The NP1 model simplifies monitoring and laboratory test requirements in the diagnosis and treatment phases (Pasulo L, Colpani M, Legri C, et al. Italian Association for the Study of the Liver Annual Meeting; 2019; Rome, Italy). The NP2 model eliminates the primary care referral requirement (i.e., “Test & Treat”), in addition to the simplifications considered in NP1.
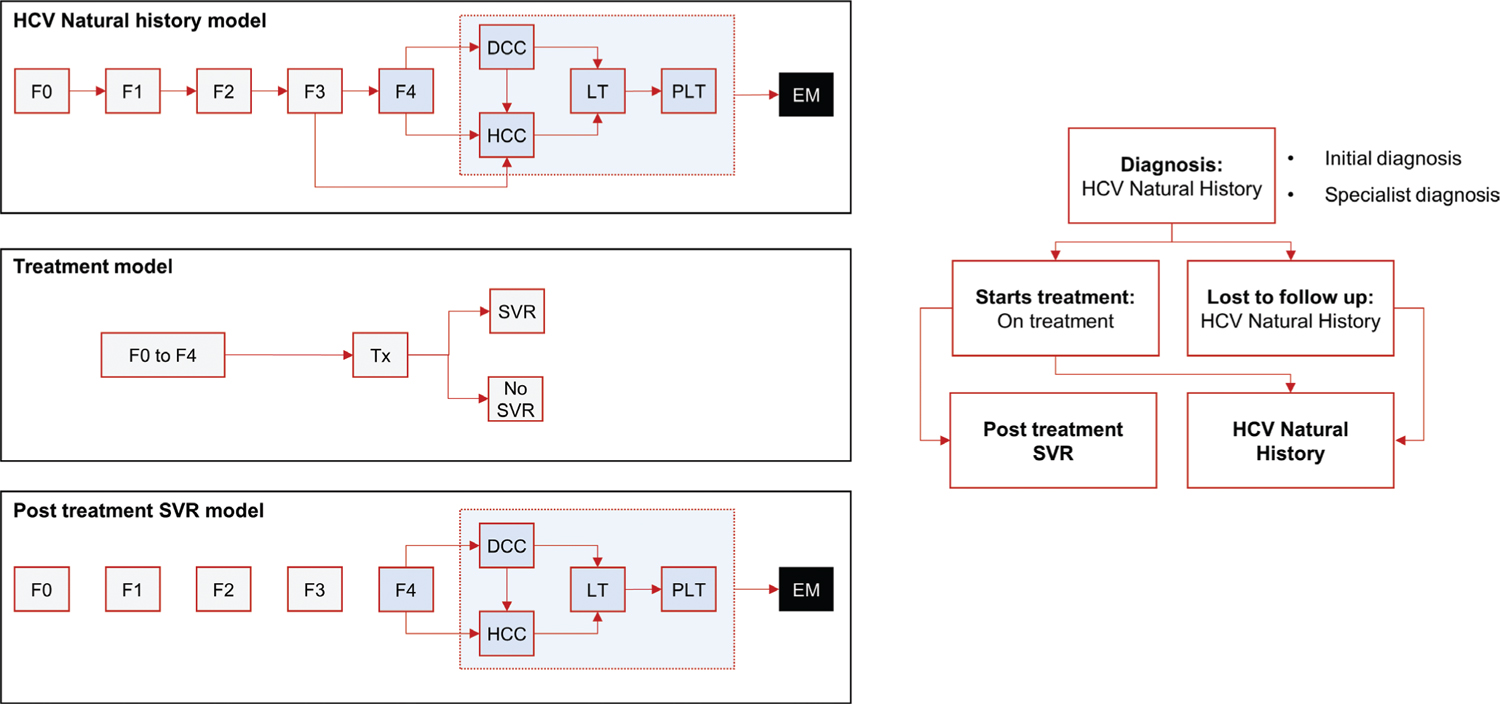
Fig. 1 - Markov model. DCC = decompensated cirrhosis; EM = extra mortality; Fn = METAVIR stage; HCC = hepatocellular carcinoma; LT = liver transplant 1st year; PLT = liver transplant 2nd year+; SVR = sustained virologic response; Tx = treatment.
| Step Category | CP Steps | NP1 | NP2 |
|---|---|---|---|
| Primary care diagnosis or non-HCV CoE | 1. Initial doctor appointment for prescription of HepC Reflex |
Same as CP | No |
2. Patient performs lab test |
Same as CP | No | |
3. Doctor appointment for prescription of other labs |
Same as CP | No | |
4. Patient performs laboratory tests (genotyping, FibroScan*, APRI, FIB-4, other) |
Partial (no genotyping or FibroScan) | No | |
5. Doctor appointment for specialist referral |
Same as CP | No | |
6. Patient is referred to the CoE |
Same as CP | No | |
| CoE specialist diagnosis | 7. First specialist appointment |
Same as CP | No |
8. Patient performs more laboratory tests |
No | No | |
9. Specialist inserts patient data in AIFA registry and requests authorization for treatment |
Same as CP | Data are introduced during the treatment phase (no need for preauthorization) | |
| Treatment | 10. Specialist appointment (treatment plan and initiation) and pharmacy pick-up of weeks 1–4 meds |
Specialist appointment and pharmacy pick-up of weeks 1–12 meds | Hospital-based/pharmacy/community HCV screening center (HepC Reflex), immediate treatment initiation, labs, specialist appointment, and pharmacy pick-up of weeks 1–12 meds |
11. Pharmacy pick-up of weeks 5–8 meds |
No | No | |
12. Pharmacy pick-up of weeks 9–12 meds |
No | No | |
13. Patient performs end of treatment laboratory tests |
No | No | |
14. End of treatment follow-up specialist appointment |
No | No | |
15. Patient performs SVR12 laboratory tests |
Same as CP | Same as CP | |
16. SVR12 specialist appointment |
Same as CP | Same as CP |
AIFA = Agenzia Italiana del Farmaco; APRI = aspartate aminotransferase to platelet ratio index; CoE = center of excellence; CP = current paradigm; FIB-4 = fibrosis-4; HCV = hepatitis C virus; NP1 = new paradigm 1; NP2 = new paradigm 2; SVR12 = sustained virologic response at 12 weeks post end of treatment; SVR24 = sustained virologic response at 24 weeks post end of treatment.
*People who inject drugs are exempted.
| Step Category | CP Steps | NP1 | NP2 |
|---|---|---|---|
| Primary care diagnosis or non-HCV CoE | 1. Initial doctor appointment for prescription of HepC Reflex |
Same as CP | No |
2. Patient performs lab test |
Same as CP | No | |
3. Doctor appointment for prescription of other labs |
Same as CP | No | |
4. Patient performs laboratory tests (genotyping, FibroScan*, APRI, FIB-4, other) |
Partial (no genotyping) | No | |
5. Doctor appointment for specialist referral |
Same as CP | No | |
6. Patient is referred to the CoE |
Same as CP | No | |
| CoE specialist diagnosis | 7. First specialist appointment |
Same as CP | No |
8. Patient performs more laboratory tests |
Same as CP | No | |
9. Patient visits the hospital to hand in test results w/o appointment |
Same as CP | No | |
10. Specialist inserts patient data in AIFA registry and requests authorization for treatment |
Same as CP | Data are introduced during the treatment phase (no need for preauthorization) | |
| Treatment | 11. Specialist appointment (treatment plan and initiation) and pharmacy pick-up of weeks 1–4 meds |
Specialist appointment and pharmacy pick-up of weeks 1–12 meds | Hospital-based/pharmacy/community HCV screening center (HepC Reflex), immediate treatment initiation, labs, specialist appointment, and pharmacy pick-up of weeks 1–12 meds |
12. Patient performs week 4 laboratory tests |
Same as CP | Same as CP | |
13. Pharmacy pick-up of weeks 5–8 meds and week 4 follow-up specialist appointment |
Week 4 follow-up specialist appointment | Week 4 follow-up specialist appointment | |
14. Patient performs week 8 laboratory tests |
Same as CP | Same as CP | |
15. Pharmacy pick-up of weeks 9–12 meds and week 8 follow-up specialist appointment |
Week 8 follow-up specialist appointment | Week 8 follow-up specialist appointment | |
16. Patient performs end of treatment laboratory tests |
Same as CP | Same as CP | |
17. End of treatment follow-up specialist appointment |
Same as CP | Same as CP | |
18. Patient performs SVR12 laboratory tests |
Same as CP | Same as CP | |
19. SVR12 specialist appointment |
Same as CP | Same as CP | |
20. Patient performs SVR24 laboratory tests |
Same as CP | Same as CP | |
21. SVR24 specialist appointment |
Same as CP | Same as CP |
AIFA = Agenzia Italiana del Farmaco; APRI = aspartate aminotransferase to platelet ratio index; CoE = center of excellence; CP = current paradigm; FIB-4 = fibrosis-4; HCV = hepatitis C virus; NP1 = new paradigm 1; NP2 = new paradigm 2; SVR12 = sustained virologic response at 12 weeks post end of treatment; SVR24 = sustained virologic response at 24 weeks post end of treatment.
*People who inject drugs are exempted.
The analysis considered the CHC population to be treated over the next 5 years (2020-2025) in Italy and modeled three separate subgroups of CHC patients: the general population, the incarcerated population, and people who inject drugs (PWIDs). The model accounted for HCV epidemiology in Italy by sourcing the number of patients anticipated to be treated per year over the next 5 years in each subgroup, by fibrotic stage and genotype distribution (GT1, GT2, GT3, or GT4), and by human immunodeficiency virus (HIV) coinfection status. Fibrotic stage distribution was classified by METAVIR fibrosis scores (no fibrosis [F0], portal fibrosis without septa [F1], portal fibrosis with few septa [F2], numerous septa without fibrosis [F3], or cirrhosis [F4]).
Patients entered the model at HCV antibody testing and only patients positive for CHC were included in the analysis. Patients were then followed through the diagnosis, treatment, and follow-up cascade to the point where cure was achieved. This cascade was based on the Agenzia Italiana del Farmaco (AIFA)-defined monitoring scheme for sofosbuvir/velpatasvir (6) and then validated by the authors. The cascade accounts for both primary care and specialist diagnosis, specialist disease staging/characterization, treatment approval, treatment initiation, and treatment-follow-up. The cascade varies by subgroup, given differences in access to care and proportion lost to follow-up [LTFU] in each step. The cascade also varies by cirrhotic (F4) versus non-cirrhotic (F0-F3) fibrotic stage since in Italy, CC patients are granted faster access to treatment and closer monitoring (Tabs. I and II).
Model inputs
The modeled population distribution by subgroup, fibrotic stage, genotype, and HIV coinfection status is shown in Supplemental Table EI. The CHC subgroup distribution (General Population, 59%; PWID, 35%; and Incarcerated, 6%) was determined by the expert opinion of the authors under the assumption that screening policies were implemented. The proportion of HIV coinfected patients in each subgroup was determined from published reports (7-9). The distribution by fibrotic stage was determined from a European HCV epidemiology modeling study and an Italian multicenter, prospective HCV economic study (10, 11). The genotype distribution in monoinfected and HIV coinfected patients were determined from an analysis of a cohort of patients with HCV in Italy (8). Historical data (12) of the number of patients treated in Italy since DAAs were introduced through October 2019 were extrapolated by the authors and applied for the next 5 years; it was assumed that 30,000 patients will be treated per year, which was deemed in the authors’ expert opinion as a credible number if the necessary resources are allocated to implement screening policies. All patients receiving treatment were assumed to be treated with a pan-genotypic regimen of sofosbuvir/velpatasvir for 12 weeks, in alignment with the simplification strategy recommended in the EASL guidelines (4). Pre- and post-treatment, patients progressed to advanced liver disease stages at the natural history rates described in published literature (13-16); post-treatment, the risk to the patient of progressing to advanced liver disease was based on whether or not SVR was achieved (Supplemental Table EII). The model used genotype-specific SVR rates, with a weighted average of 97.4% across all genotypes calculated from real-world SVR rates (Supplemental Table EIII) (17-23).
Model inputs for process time based on the CP are shown in Supplemental Table EIV. Patients LTFU were assumed not to return to care within the 5 years, thus following the natural course of disease and not achieving cure within the time horizon of the analysis. Model inputs for the estimated number of patients who are retained in care in the CP were determined by the expert opinion of the authors and are shown in Supplemental Table EV. Avoided advanced liver disease cases were estimated by means of a Markov model with transition probabilities obtained from published literature (Supplemental Table EII) (13-16).
Model inputs for costs are shown in Supplemental Table EVI. Costs for general practitioner appointments were obtained from an Italian Ministry of Health report (24) and costs for nurse appointments, specialists appointments, and laboratory tests were obtained from 2019 Italian healthcare reimbursement documents (25). Annual costs by fibrotic state and for advanced liver disease were estimated from an economic analysis of an Italian cohort with HCV (Supplemental Table EVII) (26). Nonmedical and indirect costs to patients were extrapolated from a similar study done in Portugal and adjusting for purchasing power parity (4.6 hours; 54€ (0.698/0.593) = 63.56€) (Peixe P, Aragao F, Calinas F, et al. United European Gastroenterology Week; 2019; Barcelona, Spain (27).
Outcomes evaluated
An outcome of the analysis was treatment process time in weeks from diagnosis to SVR at 12 weeks (SVR12) or 24 weeks (SVR24) post end of treatment in non-cirrhotic patients and cirrhotic patients, respectively. Additional outcomes were the number of patients with retention in care (e.g., the proportion not LTFU) and the number of patients that progress to advanced liver disease (e.g., CC, DC, HCC, and liver-related mortality). Finally, the projected total 5-year costs in Euros were calculated for each paradigm.
Deterministic sensitivity analysis
A deterministic sensitivity analysis (DSA) was run on the difference in advanced liver disease cases after 5 years and another analysis was run for the total 5-year cost difference. The base case values for model parameters and their respective ranges used for the DSA are shown in Supplemental Table EVIII.
Results
Treatment process time
Under the CP, non-cirrhotic patients require 48 weeks from diagnosis to end of treatment follow-up (16 weeks for primary care diagnosis; 7 weeks for specialist diagnosis; and 25 weeks for treatment and follow-up). These times are reduced to 13 weeks, 5 weeks, and 25 weeks for NP1 and 0 weeks, 0 weeks, and 25 weeks for NP2 (Fig. 2A). Adopting a simplification approach either at a specialist level or at the primary care level would allow process time to be reduced by 5 weeks in non-cirrhotic patients.
Under the CP, cirrhotic patients require 49 weeks from diagnosis to end of treatment follow-up (9 weeks for primary care diagnosis; 3 weeks for specialist diagnosis; and 37 weeks for treatment and follow-up). These times are reduced to 6 weeks, 3 weeks, and 37 weeks for NP1, and 0 weeks, 0 weeks, and 37 weeks for NP2 (Fig. 2B). Adopting a “Test & Treat” approach (NP2) could limit the process time to treatment duration and SVR12 follow-up in both non-cirrhotic and cirrhotic patients.
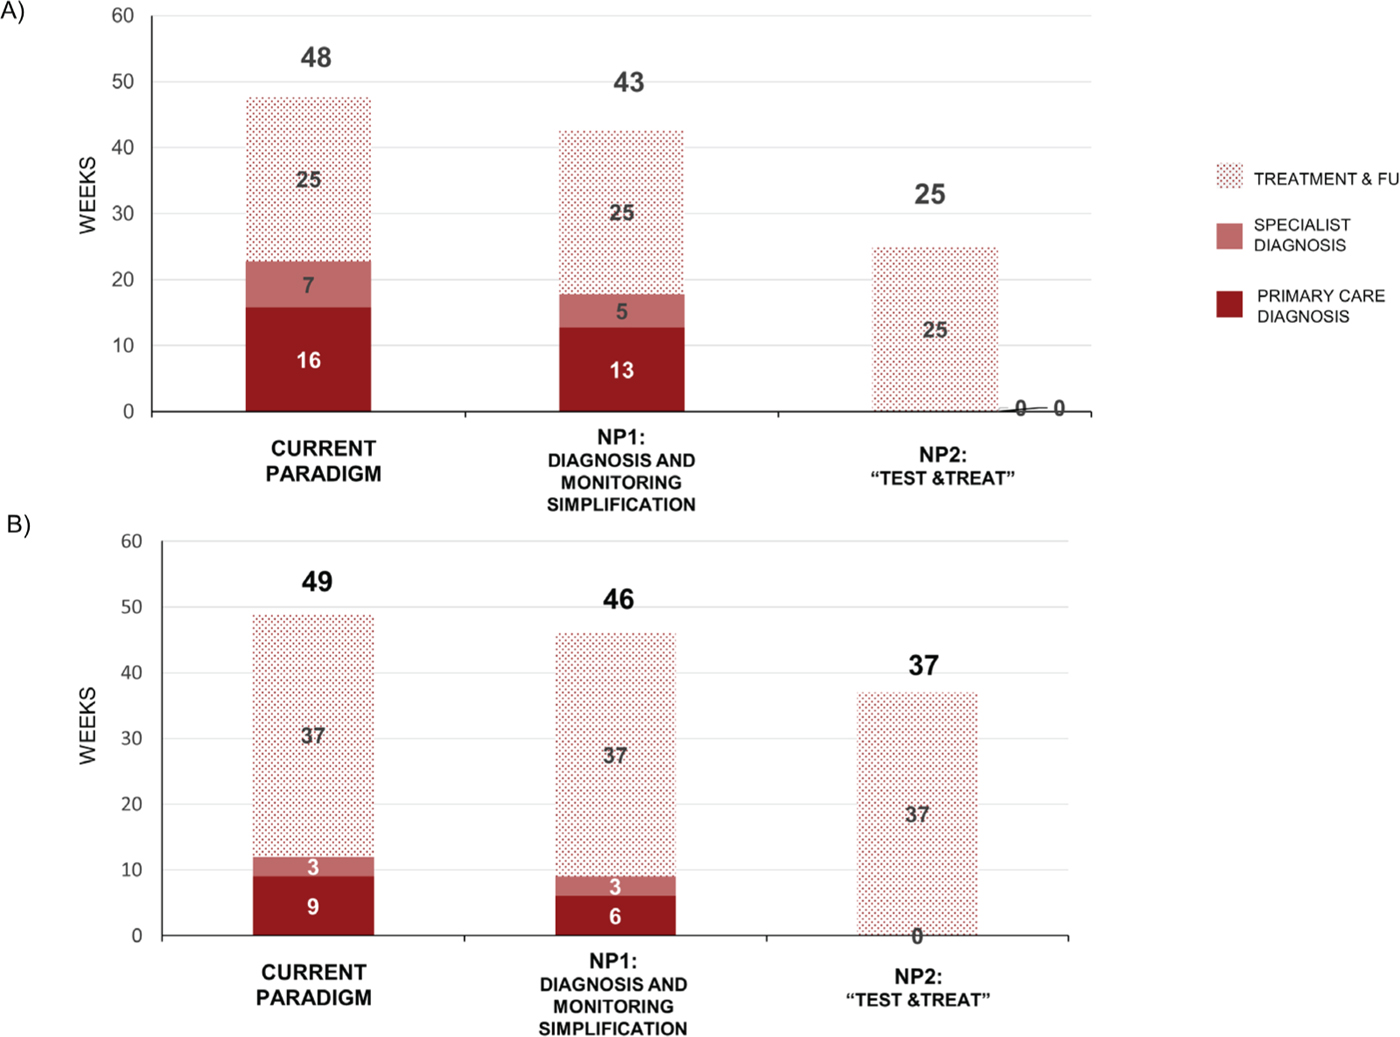
Fig. 2 - Process time for diagnosis and treatment. Data are for the current paradigm, new paradigm 1 (NP1), and new paradigm 2 (NP2) in (A) non-cirrhotic patients up to SVR12 and (B) cirrhotic patients. FU = follow-up; SVR = sustained virologic response at 12 (SVR12) or 24 (SVR24) weeks.
Retention to care
Under the CP, overall 5612 (19%) patients per year would be expected to be LTFU. The percentage of patients LTFU would be greatest in the PWID population at 25.5%, compared with 15% in the General Population and Incarcerated patients. Under NP1, 4998 would be LTFU, which is 11% fewer patients compared with the CP (Fig. 3). Under NP2, no patients would be expected to be LTFU (Fig. 3).
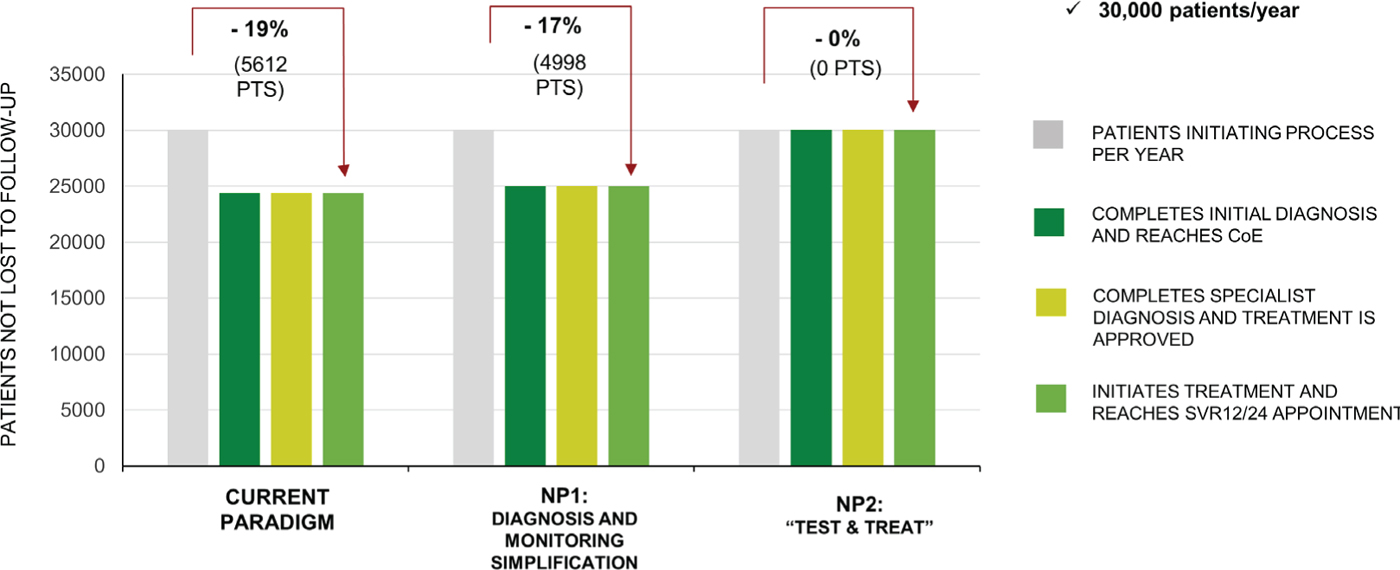
Fig. 3 - Retention to care. Data are for the current paradigm, new paradigm 1 (NP1), and new paradigm 2 (NP2). CoE = Center of Excellence; SVR = sustained virologic response at 12 (SVR12) or 24 (SVR24) weeks.
Progression to advanced liver disease
At 5 years, under the CP there would be an expected 908 CC cases, 249 DC cases, 730 HCC cases, and 338 liver-related deaths. At 5 years, implementation of NP1 would result in a reduction of 115 (12.6%) CC cases, 31 (12.4%) DC cases, 59 (8.1%) HCC cases, and 30 (8.8%) liver-related deaths when compared with the CP (Fig. 4A). At 5 years, implementation of NP2 would result in a reduction of 854 (94.0%) CC cases, 234 (93.8%) DC cases, 445 (61.0%) HCC cases, and 198 (58.4%) liver-related deaths when compared with the CP (Fig. 4B).
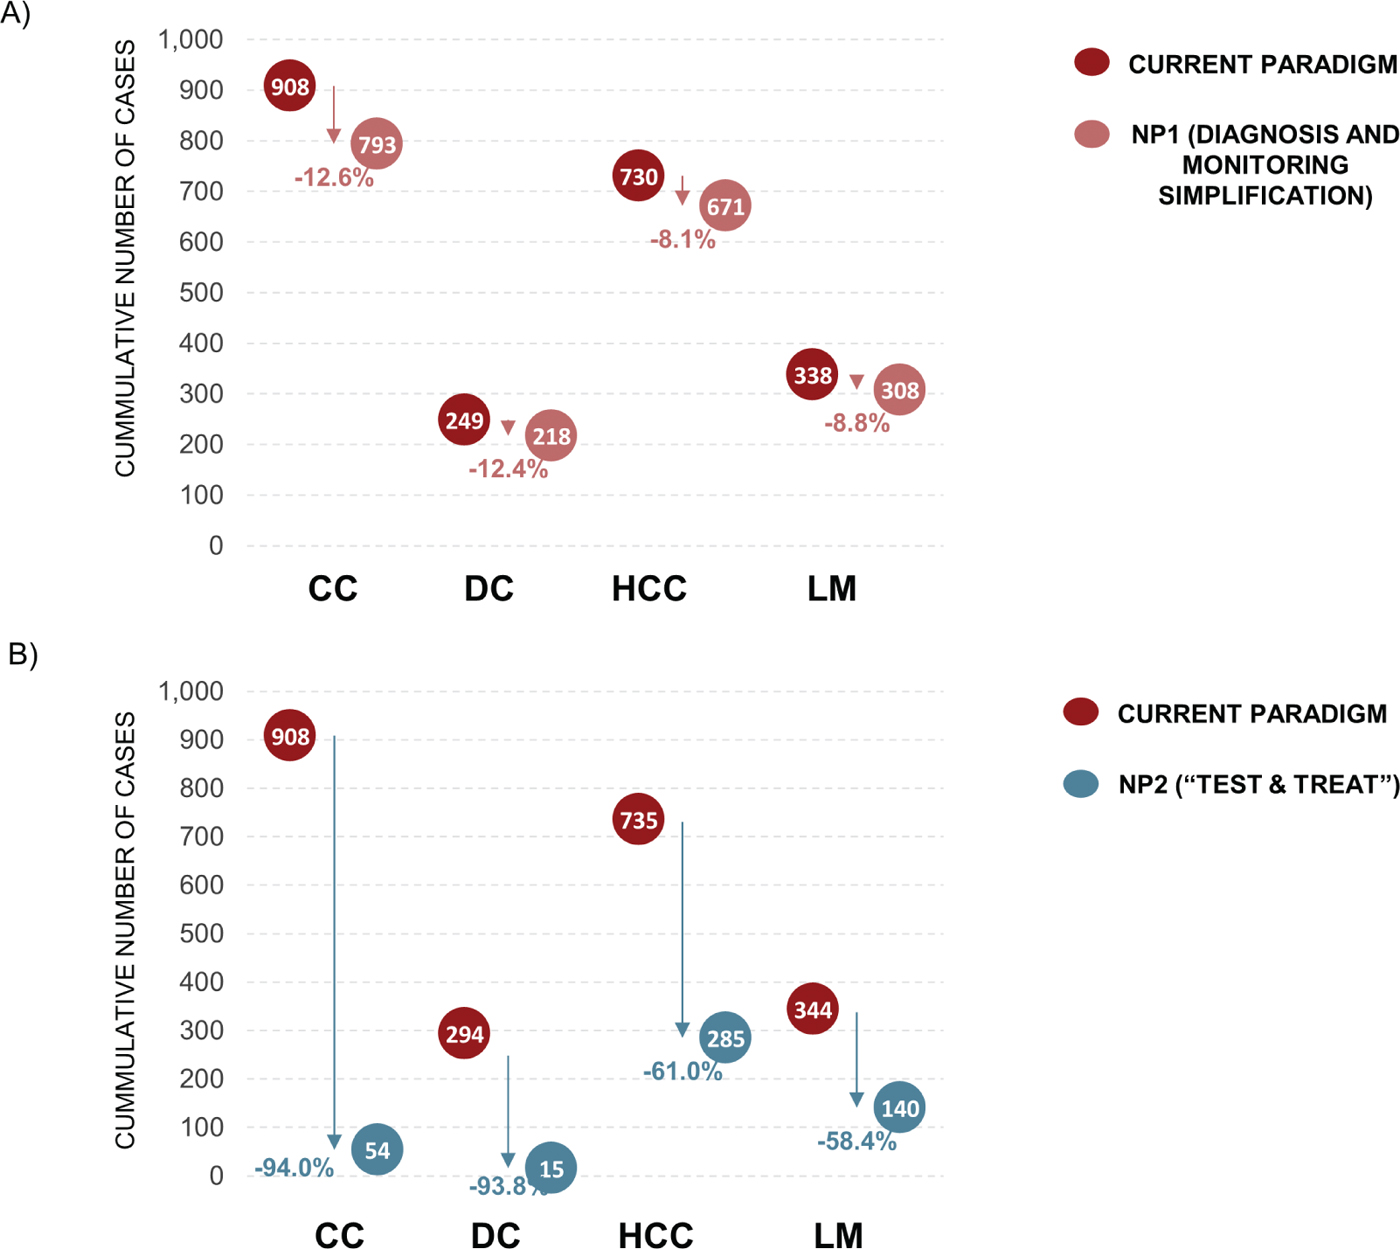
Fig. 4 - Progression to advanced liver disease. Data are for the current paradigm compared with (A) new paradigm 1 (NP1) and (B) new paradigm 2 (NP2) after 5 years. CC = compensated cirrhosis; DC = decompensated cirrhosis; HCC = hepatocellular carcinoma; LM = liver-related mortality.
As expected, given the well-established benefit of SVR on liver disease progression, the main driver in the DSA for the progression to advanced liver disease was the number of patients treated per year (Supplemental Figure E1). Available evidence, and consequently the current model, considers that progression to advanced liver disease occurs only in patients F3 or F4 (e.g., patients with lower METAVIR fibrosis stages are assumed to have to progress to F3/F4 before reaching advanced liver disease stages). As such, the proportion of patients with F3 and the speed of progression from F3 to F4 are found to be drivers #2 and #3 of advanced liver disease cases in the DSA. LTFU is highest among PWID out of the different subgroups considered. When LTFU, SVR is not achieved and these patients tend to progress at the natural history velocity. This is possibly the reason why the proportion of PWID was found to be the fourth most relevant parameter influencing the number of advanced liver disease cases predicted by the model. These results were consistent for both NP1 and NP2 when compared with the CP.
It is worth noting that in all 15 of the most impactful parameters displayed in the tornado diagrams (Supplemental Figure E1), the number of advanced liver disease cases decreases when compared to CP in both NP1 and NP2.
Costs
The total 5-year costs associated with the CP, NP1, and NP2 are estimated at 135.6€ million, 110.5€ million, and 80.5€ million, respectively (Fig. 5). Over 25€ million could be saved in NP1 by reducing LTFU, accelerating time to cure in those retained in care, and by simplifying the monitoring and laboratory requirements. In the “Test & Treat” strategy (NP2), the cost savings in NP1 would be enhanced by further reducing LTFU and time to cure among retained patients and would reach over 55€ million.
Achieving SVR reduces the number of advanced liver disease cases, which are extremely costly. Therefore, as expected, when SVR rates are high the number of patients treated has the greatest impact on predicted savings and is the biggest driver of cost outcomes identified in the DSA (Supplemental Figure E2). These results were consistent for both NP1 and NP2 when compared with the CP.
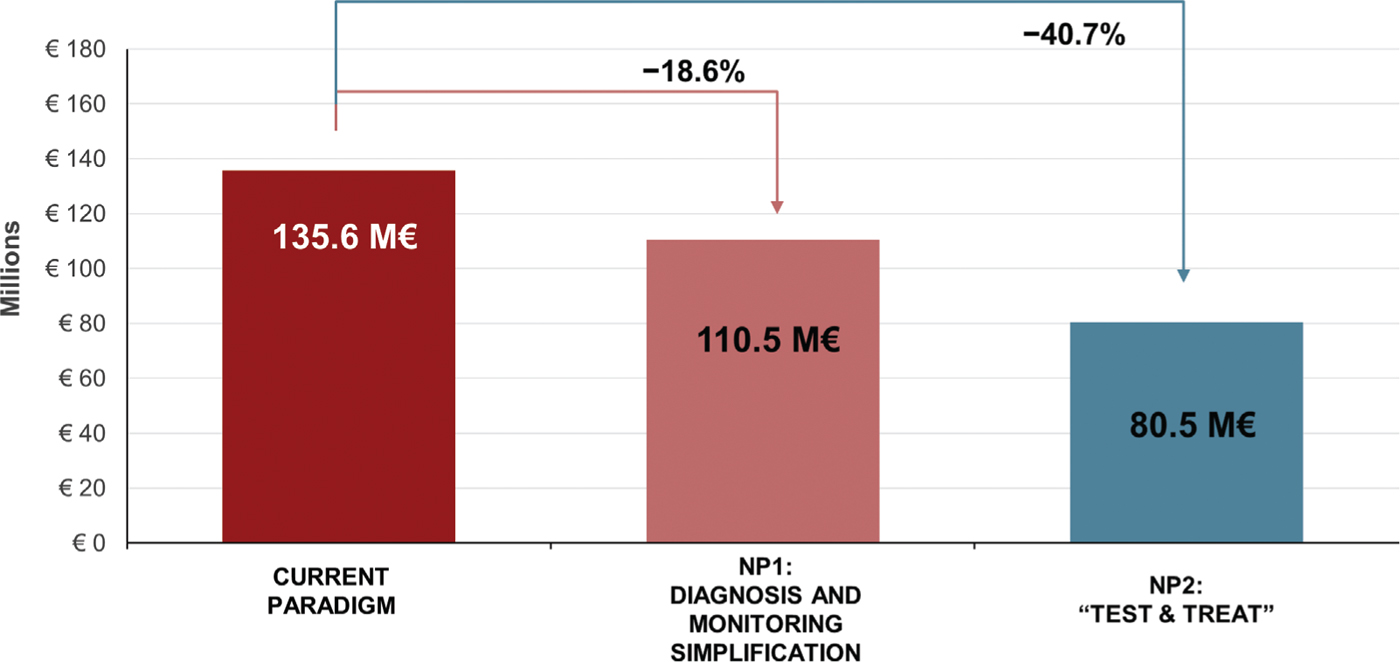
Fig. 5 - Total 5-year costs with the current paradigm, new paradigm 1 (NP1), and new paradigm 2 (NP2).
The economic burden to patients in terms of income lost and transport costs incurred (e.g., opportunity cost per visit) is found to be the second and third most important driver of results when comparing NP1 and NP2 to CP, respectively. Given the uncertainty around this parameter in respect to the currently available data, it is important to note its relevance for the results. Nonetheless, cost savings are achieved in the full spectrum of the range considered, thus suggesting that even with availability of improved quality data regarding this parameter, the results would qualitatively remain the same. The proportion of PWID assumed in the model takes third and second place as a DSA driver in the comparison of NP1 and NP2 to CP, respectively. This finding is likely linked to the rationale presented above for the drivers of advanced liver disease cases, but more importantly, as with the opportunity cost per visit parameter, cost savings are achieved within the full range considered.
It is worth noting that in all 15 of the most impactful parameters displayed in the tornado diagrams (Supplemental Figure E2), moving away from the CP results in cost savings in both NP1 and NP2.
Discussion
According to the present analysis, and considering the availability of pan-genotypic drugs, simplifying the current diagnostic and treatment pathway would lead to a reduction in the number of patients LTFU. Subsequently, there would be substantial reductions in the number of advanced liver disease cases, particularly in the NP2 “Test and Treat” strategy. Furthermore, both the NP1 and NP2 simplification strategies would result in gains for patients in terms of time and money and would save the Italian NHS up to 55€ million over the course of 5 years. The majority of the cost savings are related to reduced monitoring and laboratory testing.
The proposed NP1 simplifies the diagnostic steps in the CP by removing genotyping and FibroScan. EASL HCV guidelines recommend genotyping before starting treatment to determine choice and duration of therapy (4). However, the guidelines qualify this recommendation and state that treatment can be initiated with new pan-genotypic regimens in order to simplify access to treatment, which is in line with NP1 (4). Removing these tests would save 3 weeks in the diagnostic pathway. A simplification of the treatment and monitoring steps in NP1 is the patient pick-up of 12 weeks of medication, rather than on a monthly basis, in both non-cirrhotic and cirrhotic patients. Requiring only one pharmacy pick-up for the entire treatment period results in fewer patient LTFU and saves time for the patient. Another simplification of the CP is the removal of the SVR24 testing and specialist visit steps in patients with advance cirrhosis (F3). Standard practice in Italy is simply an ultrasound follow-up 6 months after SVR, in accordance with EASL HCV guidelines (4). Additional simplifications of the CP that are not reflected in the proposed NP1 and NP2 may also be possible. For example, monthly monitoring visits may be conducted remotely (i.e., patient sends in test results via e-mail or fax) instead of an in-office visit.
The proposed NP2 “Test and Treat” strategy is a more extreme simplification than NP1, with all of the diagnostics and treatment initiation occurring in one step. The overall number of patients LTFU could be reduced by 100%, thus improving the HCV care cascade with the goal of HCV elimination. Using the “Test and Treat” strategy, more than half of the advanced liver disease cases could be avoided, with an astounding 94% of CC cases avoided. This “Test and Treat” strategy may be particularly relevant among PWID, among whom 25.5% were estimated to be LTFU in the CP. In a study of PWID in a French drug addiction center, changing the HCV strategy from referring the patient to a hospital after an HCV positive test to initiating treatment on-site significantly increased treatment uptake from 2% to 38% (28).
Benefits of a simplified HCV monitoring procedure in Italy have been previously demonstrated in a prospective trial (Pasulo L, Colpani M, Legri C, et al. Italian Association for the Study of the Liver Annual Meeting; 2019; Rome, Italy). In the trial, patients followed either a long schedule that included monthly visits through 12 weeks of treatment and at 4 and 12 weeks post-treatment (n=15) or a simplified schedule of a visit only at DAA initiation and 12 weeks post-treatment (n=275). All monthly prescriptions and biochemical testing were done remotely. The simplified schedule resulted in 253 fewer physician working hours, 1012 fewer visits, and avoided the loss of 3.68 working days for the patient.
The main limitation of this analysis is that it considers a theoretical framework and is not possible to implement with current resource assignment and legal constraints. These would need to be changed for implementation to be possible. A limitation of the model is that empirical data were not available for all model inputs and some inputs (e.g., subgroup population distribution and retention of care in CP) were based on consensus of the authors’ expertise. The analysis also did not consider avoided transmission.
Further research is required on how the New Paradigms can be implemented in clinical practice. In the meantime, simple changes such as simplification of HCV diagnosis and monitoring procedure requirements would allow Italy to move closer to international guidelines with significant health benefits and economic gains.
Acknowledgments
Medical writing and editorial assistance were provided by Erin P. Scott, PhD, of Maple Health Group. Model was developed by Rob Blissett, of Maple Health Group.
Disclosure
Conflict of interest: S. Fagiuoli has served on advisory boards and Speaker’s bureaus for Abbvie, Gilead, MSD, Bayer, Novartis, Astellas, Intercept, and Kedrion. M. Ruggeri has nothing to disclose. F. Aragao is a former employee of Gilead Sciences and is a current employee of Maple Health Group, which provides contract services to Gilead Sciences. R. Blissett is an employee of Maple Health Group, which provides contract services to Gilead Sciences.
Financial support: This study was funded by Gilead Sciences Srl. The views expressed here are those of the authors and not necessarily those of the funders.
References
- 1. Blach S, Zeuzem S, Manns M, et al; Polaris Observatory HCV Collaborators. Global prevalence and genotype distribution of hepatitis C virus infection in 2015: a modelling study. Lancet Gastroenterol Hepatol. 2017;2(3):161-176. CrossRef PubMed
- 2. Gardini I, Bartoli M, Conforti M, Mennini FS, Marcellusi A. Estimation of the number of HCV-positive patients in Italy. PLoS One. 2019;14(10):e0223668. CrossRef PubMed
- 3. Dibonaventura MD, Yuan Y, Lescrauwaet B, et al. Multicountry burden of chronic hepatitis C viral infection among those aware of their diagnosis: a patient survey. PLoS One 2014;9(1):e86070-e.
- 4. EASL Recommendations on Treatment of Hepatitis C. J Hepatology. 2018 [cited 2020 March 18]. Online (Accessed March 31, 2021).
- 5. Guidelines for the screening, care and treatment of persons with chronic hepatitis C infection. Geneva, Switzerland: World Health Organization; 2016.
- 6. Web activation and publication of HCV register monitoring cards—policy update. Italian Medicines Agency; 2019 [cited 2020 March 23 ]. Online (Accessed March 31, 2021).
- 7. Portuguese national program for viral hepatitis, 2017 report. Portuguese Ministry of Health; 2017 [cited 2020 March 23]. Online (Accessed March 31, 2021).
- 8. Puoti M. HCV/HIV coinfection: What is learned from PITER and cohort studies. Available at: Online The PITER Meeting; Rome, Italy, 2019. (Accessed March 31, 2021).
- 9. Wiessing L, Ferri M, Grady B, et al; EMCDDA DRID group. Hepatitis C virus infection epidemiology among people who inject drugs in Europe: a systematic review of data for scaling up treatment and prevention. PLoS One. 2014;9(7):e103345. CrossRef PubMed
- 10. Chen Q, Ayer T, Bethea E, et al. Changes in hepatitis C burden and treatment trends in Europe during the era of direct-acting antivirals: a modelling study. BMJ Open. 2019;9(6):e026726. CrossRef PubMed
- 11. Cenderello G, Artioli S, Viscoli C, et al. Budget impact analysis of sofosbuvir-based regimens for the treatment of HIV/HCV-coinfected patients in northern Italy: a multicenter regional simulation. Clinicoecon Outcomes Res. 2015;8:15-21. CrossRef PubMed
- 12. Data update: Registries AIFA DAAs—chronic hepatitis C: Agenzia Italiana del Farmaco; 2019 [cited 2020 March 18]. Online (Accessed March 31, 2021).
- 13. Thein HH, Yi Q, Dore GJ, Krahn MD. Estimation of stage-specific fibrosis progression rates in chronic hepatitis C virus infection: a meta-analysis and meta-regression. Hepatology. 2008;48(2):418-431. CrossRef PubMed
- 14. Thein HH, Yi Q, Dore GJ, Krahn MD. Natural history of hepatitis C virus infection in HIV-infected individuals and the impact of HIV in the era of highly active antiretroviral therapy: a meta-analysis. AIDS. 2008;22(15):1979-1991. CrossRef PubMed
- 15. Gordon S, Lee J, Smith N, Dieterich D. Cost-effectiveness of pan-genotypic direct-acting antiviral regimens for treatment of chronic Hepatitis C in the United States. Expert Rev Pharmacoecon Outcomes Res. 2019;20(3):251-257. CrossRef PubMed
- 16. Ruggeri M, Romano F, Basile M, et al. Cost-effectiveness analysis of early treatment of chronic HCV with sofosbuvir/velpatasvir in Italy. Appl Health Econ Health Policy. 2018;16(5):711-722. CrossRef PubMed
- 17. Buggisch P, Wursthorn K, Stoehr A, et al. Real-world effectiveness and safety of sofosbuvir/velpatasvir and ledipasvir/sofosbuvir hepatitis C treatment in a single centre in Germany. PLoS One. 2019;14(4):e0214795. CrossRef PubMed
- 18. Degasperi E, Spinetti A, Lombardi A, et al; NAVIGATORE-Lombardia and Veneto Study Groups. Real-life effectiveness and safety of sofosbuvir/velpatasvir/voxilaprevir in hepatitis C patients with previous DAA failure. J Hepatol. 2019;71(6):1106-1115. CrossRef PubMed
- 19. Mangia A, Piazzolla V, Giannelli A, et al. SVR12 rates higher than 99% after sofosbuvir/velpatasvir combination in HCV infected patients with F0-F1 fibrosis stage: A real world experience. PLoS One. 2019;14(5):e0215783. CrossRef PubMed
- 20. Mangia A, Milligan S, Khalili M, et al. GS-03-Global real world evidence of sofosbuvir/velpatasvir as a simple, effective regimen for the treatment of chronic hepatitis C patients: integrated analysis of 12 clinical practice cohorts. J Hepatol. 2019;70(1):e2-e3. CrossRef
- 21. Soria A, Lapadula G, Colella E, et al. THU-180-Treatment of genotype 3 HCV infection in the large real-life “Navigatore Lombardia” multicentre cohort: results from three different regimens. J Hepatol. 2019;70(1):e241. CrossRef
- 22. Christensen S, Ingiliz P, Mauss S, et al. Do resistance associated substitutions (RAS) or Ribavirin (RBV) use influence treatment success of Sofosbuvir (SOV)/Velpatasvir (VEL) in chronic hepatitis C genotype 3 (GT 3) infection?—Results from the GErman hepatitis C COhort (GECCO). Hepatology. 2017;66(suppl 1):36A.
- 23. Fagiuoli S, Agarwal K, Mangia A, et al. Effectiveness of sofosbuvir/velpatasvir for 12 weeks in HCV genotype 3 patients with compensated cirrhosis in clinical practice cohorts from around the world. Hepatology. 2018;68(suppl 1):360A.
- 24. Remuneration of hospital care for acute care, post-acute hospitalization of rehabilitation and long-term care and specialist outpatient care. 2012 [cited 2020 March 19]. Online (Accessed March 31, 2021).
- 25. Healthcare Fund for Commercial Company Executives: Tariff Nomenclator 2020. 2020. Online (Accessed March 31, 2021).
- 26. Ruggeri M, Coretti S, Romano F, Kondili LA, Vella S, Cicchetti A. Economic evaluation of the hepatitis c virus treatment extension to early-stage fibrosis patients: evidence from the PITER real-world cohort. Value Health. 2018;21(7):783-791. CrossRef PubMed
- 27. Purchasing power parities. 2019 [cited 2020 March 20]. Online (Accessed March 31, 2021).
- 28. Moussalli J, Delaquaize H, Boubilley D, et al. Factors to improve the management of hepatitis C in drug users: an observational study in an addiction centre. Gastroenterol Res Pract. 2010;2010:261472.