|
Drug Target Insights 2023; 17: 45-53 ISSN 1177-3928 | DOI: 10.33393/dti.2023.2529 ORIGINAL RESEARCH ARTICLE |
Lipid profiles of people with human immunodeficiency virus with dyslipidemia after switching from efavirenz to dolutegravir
ABSTRACT
Introduction: Human immunodeficiency virus (HIV) infection and the long-term use of antiretroviral therapy, especially efavirenz (EFV)-based regimens, impact lipid profiles due to insulin resistance and lead to a higher risk of metabolic diseases. Dolutegravir (DTG) is an integrase inhibitor with better lipid profiles than EFV. However, data on treatment experience in Thailand are limited. The primary outcome was lipid profile changes at 24 weeks after switching therapy.
Methods: We conducted a prospective, open-label, cohort study in people with HIV aged ≥18 years who had undergone at least 6 months of EFV-based therapy, had HIV-1 ribonucleic acid levels <50 copies/mL for ≥6 months before switching, and were diagnosed with dyslipidemia or had risk factors for atherosclerosis cardiovascular disease based on modified National Cholesterol Education Program Adult Treatment Panel III guidelines.
Results: Sixty-four patients were enrolled. The mean age (standard deviation [SD]) was 48.20 ± 10.46 years, and 67.19% were male. At week 24, there were decreases from baseline in mean total cholesterol, low-density lipoprotein cholesterol, high-density lipoprotein cholesterol, and triglycerides. However, mean body weight and waist circumference had increased.
Conclusions: DTG resulted in better lipid profiles after switching from EFV-based therapy, suggesting that this switch could benefit patients with a high risk of cardiovascular disease. However, it is essential to note that weight gain and increased waist circumference were also observed.
Keywords: ARV, Dolutegravir, Dyslipidemia, Efavirenz, Switching treatment
Received: November 18, 2022
Accepted: April 11, 2023
Published online: April 28, 2023
Corresponding author:
Atibordee Meesing
Department of Medicine
Faculty of Medicine
Khon Kaen University
Khon Kaen 40002 - Thailand
atibordee@kku.ac.th
Drug Target Insights - ISSN 1177-3928 - www.aboutscience.eu/dti
© 2023 The Authors. This article is published by AboutScience and licensed under Creative Commons Attribution-NonCommercial 4.0 International (CC BY-NC 4.0).
Commercial use is not permitted and is subject to Publisher’s permissions. Full information is available at www.aboutscience.eu
Introduction
People with human immunodeficiency virus (HIV) typically have the potential to live for a considerable length of time after receiving highly active antiretroviral therapy (HAART). The virus triggers an inflammatory response that can result in metabolic issues such as diabetes mellitus, hypertension, and dyslipidemia. The prevalence of people with HIV with dyslipidemia is as high as 51% (1).
Long-term use of antiretroviral treatment regimens may lead to dyslipidemia, which is a significant risk factor for cardiovascular disease (2,3,4,5). Previously, people with HIV in Thailand were typically prescribed a first-line antiretroviral regimen that included efavirenz (EFV) along with two nucleoside reverse transcriptase inhibitors (NRTIs) (6).
As a long-acting non-nucleoside reverse transcriptase inhibitor (NNRTI), EFV is an effective form of HIV treatment in clinical settings. However, there are side effects such as drug rash, hepatitis, and long-term metabolic diseases (3,4). This can raise the likelihood of developing hyperglycemia and subsequent insulin resistance while also affecting lipid metabolism. In addition, it can hinder the breakdown of fat, leading to an increase in triglycerides, very-low-density lipoprotein (VLDL), and low-density lipoprotein (LDL) levels, and a decrease in high-density lipoprotein (HDL) levels. This ultimately results in dyslipidemia, which can eventually cause cardiovascular disease (2).
The US Food and Drug Administration approved dolutegravir (DTG) in 2013 as an integrase strand transfer inhibitor (INSTI)-based regimen, which works by inhibiting integrase, an enzyme that HIV needs to insert its deoxyribonucleic acid (DNA) into the DNA of host lymphocytes (7). It is highly effective, has few side effects compared to other drugs, and only needs to be taken once per day. However, there have been some reports of patients gaining weight after taking this drug long term (8). It is currently the first-line antiretroviral regimen administered in Thailand (9).
A randomized controlled trial in naive people with HIV compared the levels of lipids between an EFV group and DTG group and found that the latter had less of an increase in cholesterol (10,11,12).
A comprehensive approach is necessary for dyslipidemia management in people with HIV, which may involve lifestyle modification including controlled calories intake, exercise, and maintaining a healthy body weight or wight reduction. Another approach is to choose antiretroviral drugs that do not worsen dyslipidemia, and to modify antiretroviral therapy when necessary to control lipid levels. The use of lipid-lowering agents, such as statin agents and fibrates, may also be essential to reduce the risk of cardiovascular disease. At present, there are limited data available on switching from EFV to DTG in people with HIV who have dyslipidemia in Thailand.
The main goal of this study was to examine alterations in the lipid profile of people with HIV who have dyslipidemia, specifically at the 24-week mark following the switch from EFV to DTG. Secondary objectives were to evaluate the efficacy of DTG in maintaining HIV-1 ribonucleic acid (RNA) levels at <50 copies/mL after 24 weeks of switching treatment, as well as its safety, tolerability, body weight, body mass index (BMI), and waist circumference.
Methods
A prospective, open-label cohort study was conducted at Srinagarind Hospital, a tertiary university hospital in northeastern Thailand, between April 2021 and April 2022. The patients were eligible for the study if they met all the following criteria: (1) age over 18 years, (2) having received EFV-based therapy for at least 6 months, (3) HIV-1 RNA <50 copies/mL for ≥6 months before switching therapies, (4) diagnosis with dyslipidemia or risk factors for atherosclerosis cardiovascular disease (ASCVD) based on modified National Cholesterol Education Program (NCEP) Adult Treatment Panel (ATP) III guidelines (13). In brief, dyslipidemia was defined as either (1) LDL-cholesterol ≥130 mg/dL with at least one of the following coronary heart disease (CHD) risk factors: age >45 years if male or age >55 years if female, hypertension (blood pressure ≥140/90 mmHg or on antihypertensive medication), current cigarette smoking, or family history of premature CHD and/or diabetes; (2) LDL-cholesterol ≥160 mg/dL regardless of CHD risk factors; or (3) previous diagnosis of dyslipidemia and on lipid-lowering drugs. Exclusion criteria were pregnancy or breastfeeding, active opportunistic infections, or taking metformin >1,000 mg/day, rifampicin, St. John’s wort, antiarrhythmic drugs (e.g., dofetilide, pilsicainide), antiepileptic drugs (e.g., carbamazepine, oxcarbazepine, phenytoin, phenobarbital), or medications or supplements containing polyvalent cations (e.g., magnesium, aluminum, cation-containing antacids or laxatives, sucralfate, buffered medications).
Patient evaluation was performed at baseline, week 12, and week 24. Data collected for each participant included age, sex, body weight, height, BMI, waist circumference, backbone regimen, CHD risks, current lipid-lowering agents, duration from HIV diagnosis to enrollment, duration of first treatment with antiretroviral agents to enrollment, and duration of EFV treatment to that with lipid-lowering agents. Clinical laboratory testing was performed at a local laboratory. Laboratory tests included HIV-1 RNA, absolute CD4 cell count, %CD4, and lipid profiles including total cholesterol, LDL-cholesterol, HDL-cholesterol, and triglycerides. The safety of the studied regimens was assessed using patient interviews, medical history, physical examination, and clinical laboratory test results.
Study procedure
Upon approval to undertake the project by the Human Research Committee at Khon Kaen University, the patients were screened and provided informed consent to be enrolled into this study. Blood tests were obtained on the date of enrollment according to protocols. Patients were changed from an EFV-based to a DTG-based regimen and received dosing instructions from the investigators. Patients had two follow-up appointments at 12 (±1) and 24 (±1) weeks.
The study protocol was reviewed and approved by the Khon Kaen University Center of Ethics in Human Research (HE641043).
Sample size calculation
Assuming a change in LDL-cholesterol level of 10.67, a standard deviation (SD) of ±30.37 mg/dL extrapolated from a study with 80% power, and a one-sided type 1 error of 0.05, a sample size of 64 patients was necessary. We calculated a 10% loss to follow-up, making the total required population 70 patients.
Statistical analysis
The data were analyzed using Statistical Package for the Social Sciences (SPSS) version 26. Categorical data were expressed as proportions, and continuous data were expressed as mean and SD, 95% confidence interval (CI), or median (range), as appropriate. The data depended on whether the distribution was normal or non-normal. Comparisons between values before and after changing medications were performed using a paired dependence t-test or proportional McNemar test, as appropriate.
Results
A total of 64 patients with dyslipidemia were enrolled in the study at baseline, followed up on for 12 weeks, and attended study visits for 24 weeks (Fig. 1).
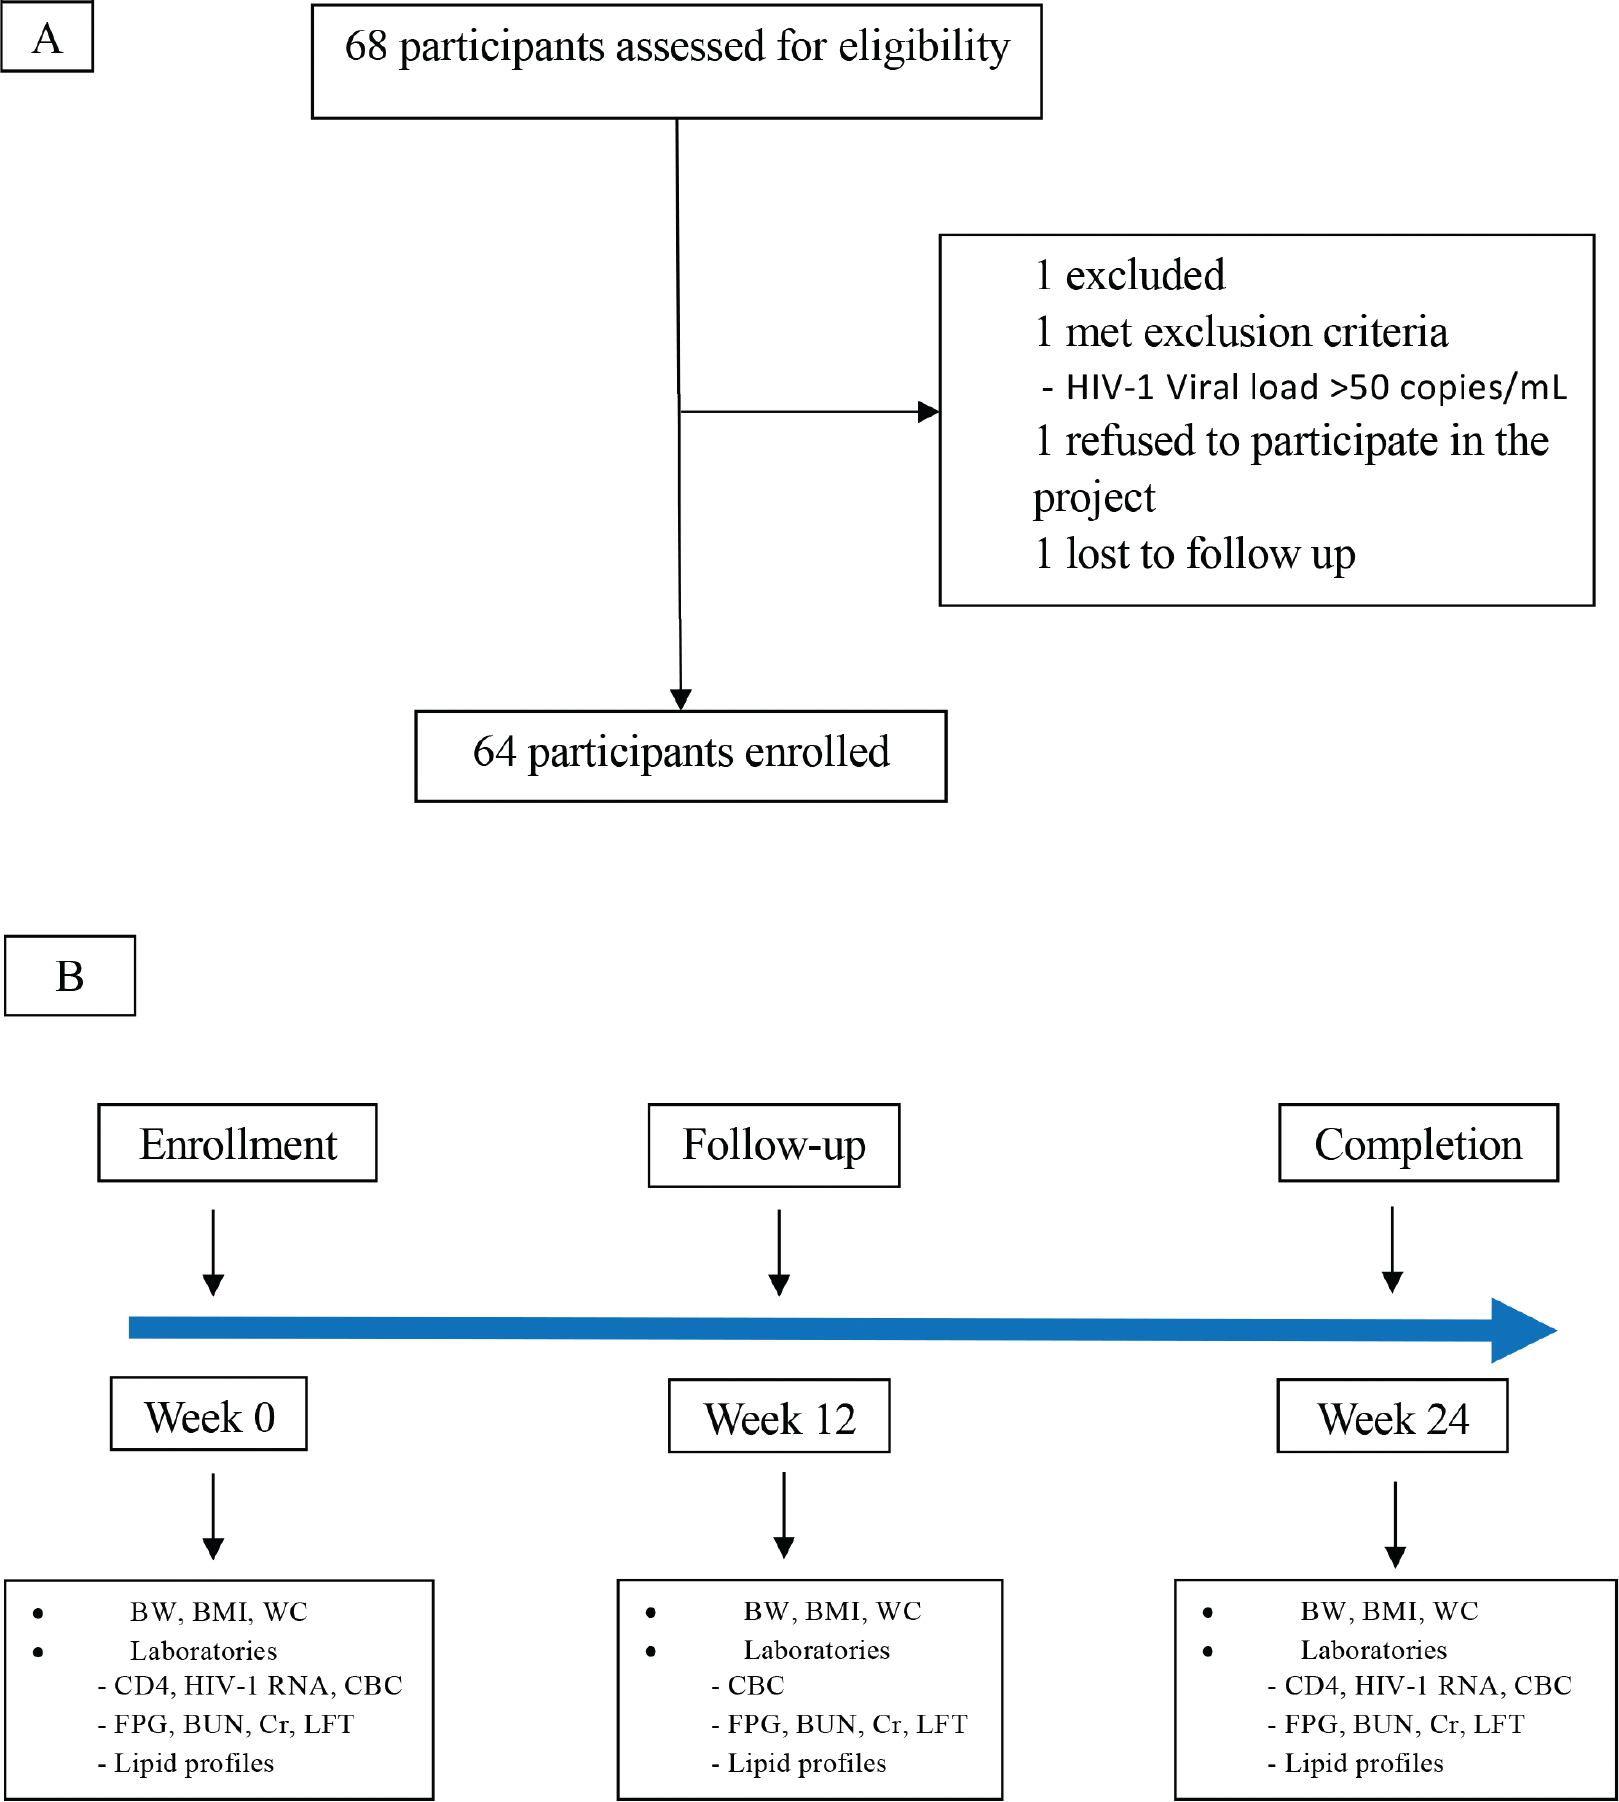
Figure 1 - Panel A shows the flow diagram. Panel B shows the protocols from eligible week until follow-up at week 12 and week 24. BMI = body mass index; BUN = blood urea nitrogen; BW = body weight; CBC = complete blood count; CD4 = cluster of differentiation 4; Cr = creatinine; FPG = fasting plasma glucose; HIV RNA = human immunodeficiency virus ribonucleic acid; LFT = liver function test; WC = waist circumference.
The majority of patients were male (67.19%), and mean age (SD) was 48.20 ± 10.46 years. Mean absolute CD4 count was 603.27 ± 237.08 cells/mm3. Mean duration from diagnosis of HIV and from first antiretroviral agents until switching therapy were 103.44 ± 57.79 and 88.81 ± 44.53 months, respectively.
Mean body weight, height, BMI, and waist circumference were 66.0 ± 12.02 kg, 165.56 ± 8.80 cm, 23.99 ± 3.51 kg/m2, and 87.79 ± 10.82 cm, respectively.
The most common NRTI backbones were tenofovir disoproxil fumarate (TDF)/emtricitabine (FTC; 84.38%), followed by abacavir (ABC)/lamivudine (3TC; 14.06%) and TDF/3TC (1.56%). CHD risk factors were dyslipidemia (75.00%), hypertension (12.50%), and diabetes mellitus (3.13%). None of the patients were current smokers.
Of 64 patients, 45 (70.31%) received lipid-lowering agents for dyslipidemia before switching to a DTG-based regimen. The mean duration to initiation of lipid-lowering agents after starting EFV was 35.22 ± 49.16 months. The most common lipid-lowering agents were simvastatin (34.38%), atorvastatin (21.88%), and rosuvastatin (6.25%). Patient demographics and baseline characteristics are summarized in Table I.
At week 12
Mean total cholesterol decreased significantly from baseline (−38.81 mg/dL, 95% CI −32.35 to −12.00, p < 0.001), as did LDL-cholesterol (−25.70 mg/dL, 95% CI −31.53 to −19.88, p < 0.001), HDL-cholesterol (−6.24 mg/dL, 95% CI −8.12 to −4.36, p < 0.001), and triglycerides (−36.17 mg/dL, 95% CI −58.62 to −13.71, p = 0.002). Mean changes in fasting lipid parameters from baseline are presented in Table II and Fig. 2.
| Characters | Total N = 64 |
|---|---|
| Age, mean (SD) years | 48.20 ± 10.46 |
| Male, n (%) | 43 (67.19) |
| Bodyweight, mean (SD) kg | 66.0 ± 12.02 |
| Height, mean (SD) cm | 165.56 ± 8.80 |
| Body mass index, mean (SD) kg/m2 | 23.99 ± 3.51 |
| • Underweight, < 18.5, n (%) | 0 (0.0) |
| • Normal, ≥18.5 to <25, n (%) | 42 (65.62) |
| • Overweight, ≥25 to <30, n (%) | 19 (29.69) |
| • Obese, ≥30, n (%) | 3 (4.69) |
| Waist circumference, mean (SD) cm | 87.79 ± 10.82 |
| Backbone regimen | |
| • TDF/FTC, n (%) | 54 (84.38) |
| • ABC/3TC, n (%) | 9 (14.06) |
| • TDF/3TC, n (%) | 1 (1.56) |
| Current CD4, mean (SD) | |
| • Absolute CD4, cells/mm3 | 603.27 ± 237.08 |
| • %CD4 | 26.03 ± 8.22 |
| Coronary heart disease risk, n (%) | |
| • Dyslipidemia | 48 (75.00) |
| • Hypertension | 8 (12.50) |
| • Diabetes mellitus | 2 (3.13) |
| • Current smoking | 0 (0.0) |
| Current lipid-lowering agent, n (%) | |
| • None | 19 (29.69) |
| • Simvastatin | 22 (34.38) |
| • Atorvastatin | 14 (21.88) |
| • Rosuvastatin | 4 (6.25) |
| • Fenofibrate | 2 (3.12) |
| • Simvastatin plus gemfibrozil | 2 (3.12) |
| • Atorvastatin plus fenofibrate | 1 (1.56) |
| Duration of HIV diagnosis to enrollment, mean (SD) months | 103.44 ± 57.79 |
| Duration of the first antiretroviral agents to enrollment, mean (SD) months | 88.81 ± 44.53 |
| Duration of efavirenz to lipid-lowering agents, mean (SD) months | 35.22 ± 49.16 |
| Laboratory parameters | |
| • Hemoglobin, g/dL | 13.84 ± 2.09 |
| • Fasting plasma glucose, mg/dL | 98.88 ± 12.41 |
| • Creatinine, mg/dL | 0.96 ± 0.16 |
| • eGFR, mL/min/1.73 m2 | 85.46 ± 22.16 |
| • Albumin, g/dL | 4.76 ± 0.42 |
| • Alanine aminotransferase, U/L | 36.78 ± 23.79 |
| • Aspartate aminotransferase, U/L | 32.13 ± 19.66 |
| • Alkaline phosphatase, U/L | 105.86 ± 31.35 |
3TC = lamivudine; ABC = abacavir; eGFR = estimated glomerular filtration rate; FTC = emtricitabine; TDF = tenofovir disoproxil fumarate; SD = standard deviation.
There were statistically significant increases from baseline in mean body weight (0.97 kg, 95% CI 0.49 to 1.44, p < 0.001), BMI (0.32 kg/m2, 95% CI 0.16 to 0.49, p < 0.001), and waist circumference (1.53 cm, 95% CI 0.88 to 2.18, p < 0.001; Table III and Fig. 3).
At week 24
Mean total cholesterol had decreased significantly from baseline (−32.78 mg/dL, 95% CI −41.16 to −24.39, p < 0.001), LDL-cholesterol (−21.00 mg/dL, 95% CI −28.34 to −13.65, p < 0.001), HDL-cholesterol (−4.21 mg/dL, 95% CI −6.24 to −2.18, p < 0.001), and triglycerides (−49.70 mg/dL, 95% CI −66.54 to −32.86, p < 0.001). Mean changes in fasting lipid parameters from baseline are presented in Table II and Fig. 2.
There were significant increases from baseline in mean body weight (1.39 kg, 95% CI 0.77 to 2.01, p < 0.001), BMI (0.49 kg/m2, 95% CI 0.27 to 0.73, p < 0.001), and waist circumference (2.6 cm, 95% CI 1.53 to 3.68, p < 0.001; Table III and Fig. 3).
Of 64 patients, 61 (95.31%) had HIV-1 RNA <50 copies/mL at week 24. The HIV-1 RNA of the remaining three were 52, 67, and 62 copies/mL. Nonstatistically significant changes were seen in absolute CD4 (24.09 cells/mm3, 95% CI −9.60 to 57.79, p = 0.158).
Mean changes in other laboratory parameters are as follows: fasting blood sugar = 0.45 mg/dL, 95% CI −5.70 to 4.79, p = 0.864, creatinine = 0.15 mg/dL, 95% CI 0.11 to 0.18, p < 0.001, and estimated glomerular filtration rate (eGFR) = −9.50 mL/min/1.73 m2, 95% CI −11.97 to −7.04, p < 0.001 (Table IV).
Discussion
The use of DTG-based regimen is currently widespread as a first-line antiretroviral treatment globally, including in Thailand. This study found that switching to DTG-based regimen in people with HIV with dyslipidemia resulted in improved lipid profiles.
The SCOTA study is a large observational cohort study that examined patients who switched from EFV to DTG, EFV to elvitegravir (EVG), or EFV to rilpivirine (RPV). It was found that total cholesterol significantly decreased in the EFV to DTG and EFV to RPV groups but not in the EFV to EVG group. At month 12, total cholesterol/HDL had significantly decreased in the EFV to RPV group but not in the EFV to DTG and EFV to EVG groups. The study results showed that significant reductions in triglycerides were observed only in the group that switched from EFV to RPV. Furthermore, the decrease in total cholesterol, LDL-cholesterol, triglycerides, and total cholesterol/HDL over 1 year was higher in patients with higher baseline levels (14).
The STRATEGY-NNRTI trial examined the effects of switching from an NNRTI-based regimen (EFV, NVP, or RPV) combined with TDF and FTC to coformulated EVG/cobicistat (c), TDF, or FTC or continuing the NNRTI-based regimen. At 48 weeks, the only significant reduction in plasma lipid levels was observed in HDL-cholesterol levels in patients who switched to the EVG/c-based regimen compared to those who continued in the NNRTI-based regimen. The changes in lipid levels varied based on the type of NNRTI. Switching from EFV to the EVG/c-based regimen led to a significant decrease in total cholesterol and LDL-cholesterol and a slight decrease in HDL-cholesterol compared to those who continued EFV. Switching from NVP or RPV to EVG/c led to substantial increases in LDL-cholesterol and the cholesterol/HDL ratio compared to continuing with NVP or RPV (15). However, other recent studies have shown that switching to RPV or a once-daily integrase regimen can improve lipid profiles and reduce dyslipidemia without causing virological failure (14,15,16).
| Lipid profiles (mg/dL) | N = 64; mean (SD) | |||||||||||
|---|---|---|---|---|---|---|---|---|---|---|---|---|
| Week 0 | Week 12 | Week 24 | Change from week 0 vs. 12 | p-Value | Change from week 0 vs. 24 | p-Value | Change from week 12 vs. 24 | p-Value | ||||
| Diff | 95% CI | Diff | 95% CI | Diff | 95% CI | |||||||
| Total cholesterol | 209.69 ± 38.99 | 170.88 ± 36.43 | 176.91 ± 35.14 | −38.81 ± 25.86 | −32.35, −12.00 | <0.001 | −32.78 ± 33.55 | −41.16, −24.39 | <0.001 | 6.03 ± 33.56 | −2.35, 14.41 | 0.156 |
| LDL-cholesterol | 131.88 ± 36.17 | 106.17 ± 31.37 | 110.88 ± 30.72 | −25.70 ± 23.31 | −31.53, −19.88 | <0.001 | −21.00 ± 29.41 | −28.34, −13.65 | <0.001 | 4.71 ± 26.78 | −1.98, 11.39 | 0.165 |
| HDL-cholesterol | 54.45 ± 13.56 | 48.20 ± 12.48 | 50.23 ± 13.23 | −6.24 ± 7.52 | −8.12, −4.36 | <0.001 | −4.21 ± 8.12 | −6.24, −2.18 | <0.001 | 2.03 ± 6.13 | 0.49, 3.56 | 0.010 |
| Triglycerides | 181.64 ± 94.12 | 145.47 ± 77.75 | 131.94 ± 75.28 | −36.17 ± 89.88 | −58.62, −13.71 | 0.002 | −49.70 ± 67.40 | −66.54, −32.86 | <0.001 | 13.53 ± 67.79 | −30.46, 3.40 | 0.115 |
| Cholesterol/HDL | 4.00 ± 0.93 | 3.69 ± 1.01 | 3.69 ± 1.06 | −0.31 ± 0.61 | −0.46, −0.15 | <0.001 | −0.31 ± 0.85 | −0.52, −0.09 | 0.005 | −0.003 ± 0.81 | −0.21, 1.9 | 0.973 |
CI = confidence interval; HDL = high-density lipoprotein; LDL = low-density lipoprotein; SD = standard deviation.
| N = 64; mean (SD) | ||||||||||||
|---|---|---|---|---|---|---|---|---|---|---|---|---|
| Week 0 | Week 12 | Week 24 | Change from week 0 vs. 12 | p-Value | Change from week 0 vs. 24 | p-Value | Change from week 12 vs. 24 | p-Value | ||||
| Diff | 95% CI | Diff | 95% CI | Diff | 95% CI | |||||||
| Bodyweight, kg | 66.00 ± 12.02 | 66.97 ± 12.46 | 67.39 ± 12.58 | 0.97 ± 1.88 | 0.49, 1.44 | <0.001 | 1.39 ± 2.49 | 0.77, 2.01 | <0.001 | 0.42 ± 1.85 | −0.04, 0.88 | 0.073 |
| Body mass index, kg/m2 | 23.99 ± 3.51 | 24.32 ± 3.55 | 24.49 ± 3.67 | 0.32 ± 0.67 | 0.16, 0.49 | <0.001 | 0.49 ± 0.92 | 0.27, 0.73 | <0.001 | 0.17 ± 0.68 | −0.001, 0.34 | 0.051 |
| Waist circumference, cm | 87.79 ± 10.82 | 89.33 ± 11.38 | 90.39 ± 10.95 | 1.53 ± 2.60 | 0.88, 2.18 | <0.001 | 2.60 ± 4.27 | 1.53, 3.68 | <0.001 | 1.06 ± 3.65 | 0.15, 1.97 | 0.023 |
| ASCVD risk score* | 4.56 ± 4.30(N = 42) | 3.99 ± 3.71(N = 39) | 4.69 ± 4.67(N = 44) | 0.464 ± 1.43 | −0.04, 0.97 | 0.07 | 0.14 ± 1.92 | −0.49, 0.77 | 0.66 | −0.11 ± 1.48 | −0.59, 0.38 | 0.66 |
ASCVD = atherosclerotic cardiovascular disease; LDL = low-density lipoprotein; SD = standard deviation.
*Calculated score from patient age above 40 years old and LDL level above 70 mg/dL.
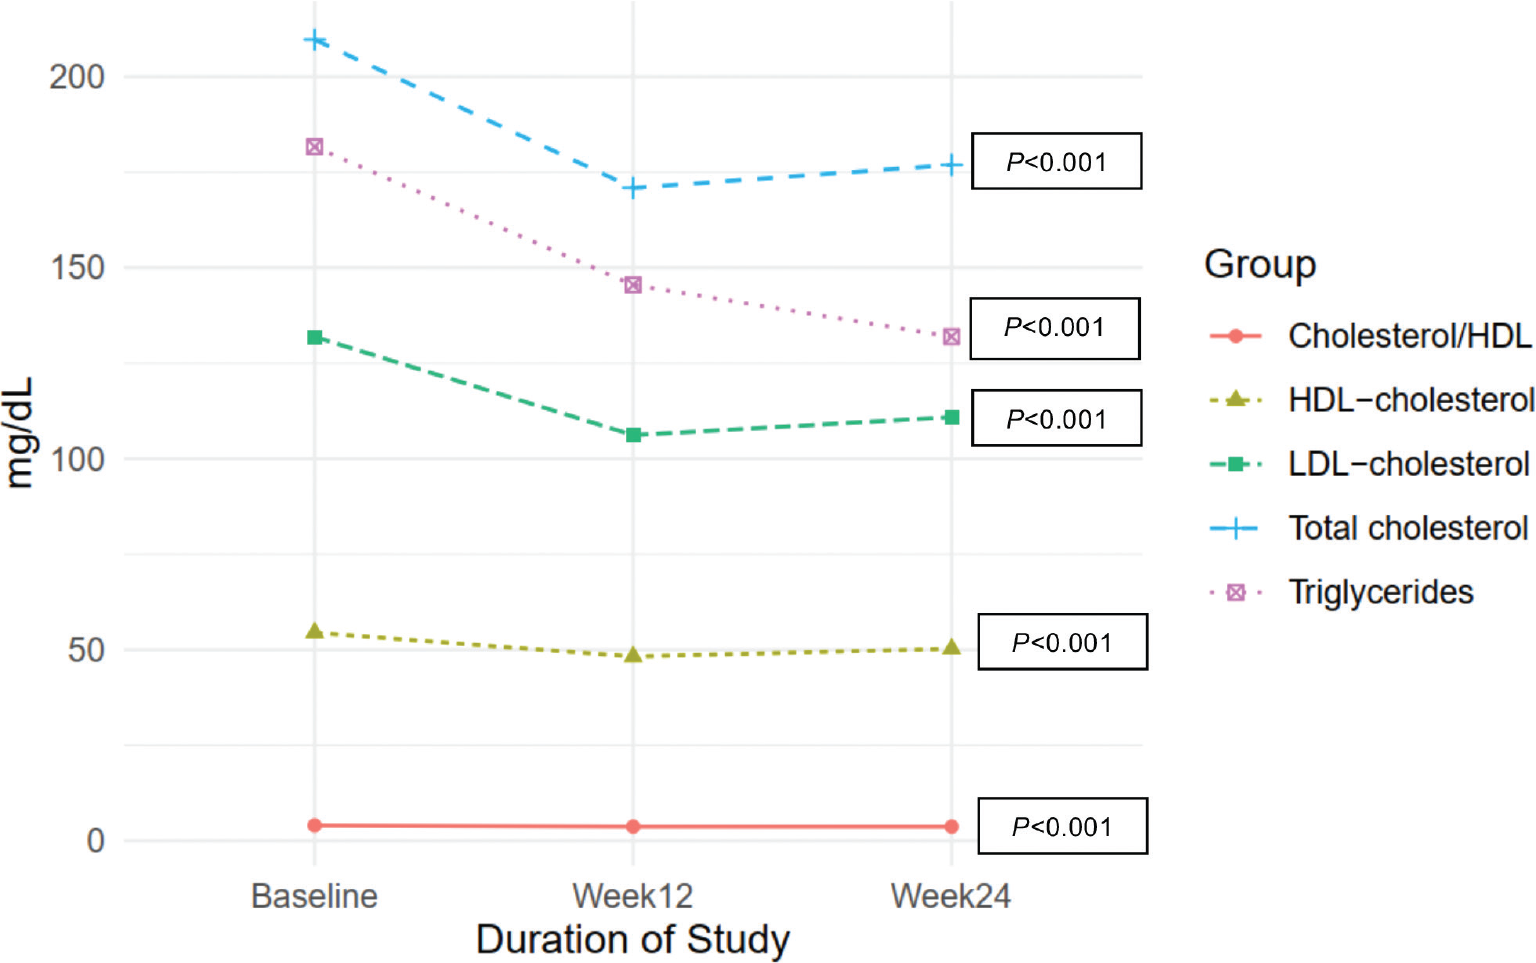
Figure 2 - Change in mean total cholesterol, LDL-cholesterol, HDL-cholesterol, triglycerides, and cholesterol/HDL from baseline through week 24. HDL = high-density lipoprotein; LDL = low-density lipoprotein.
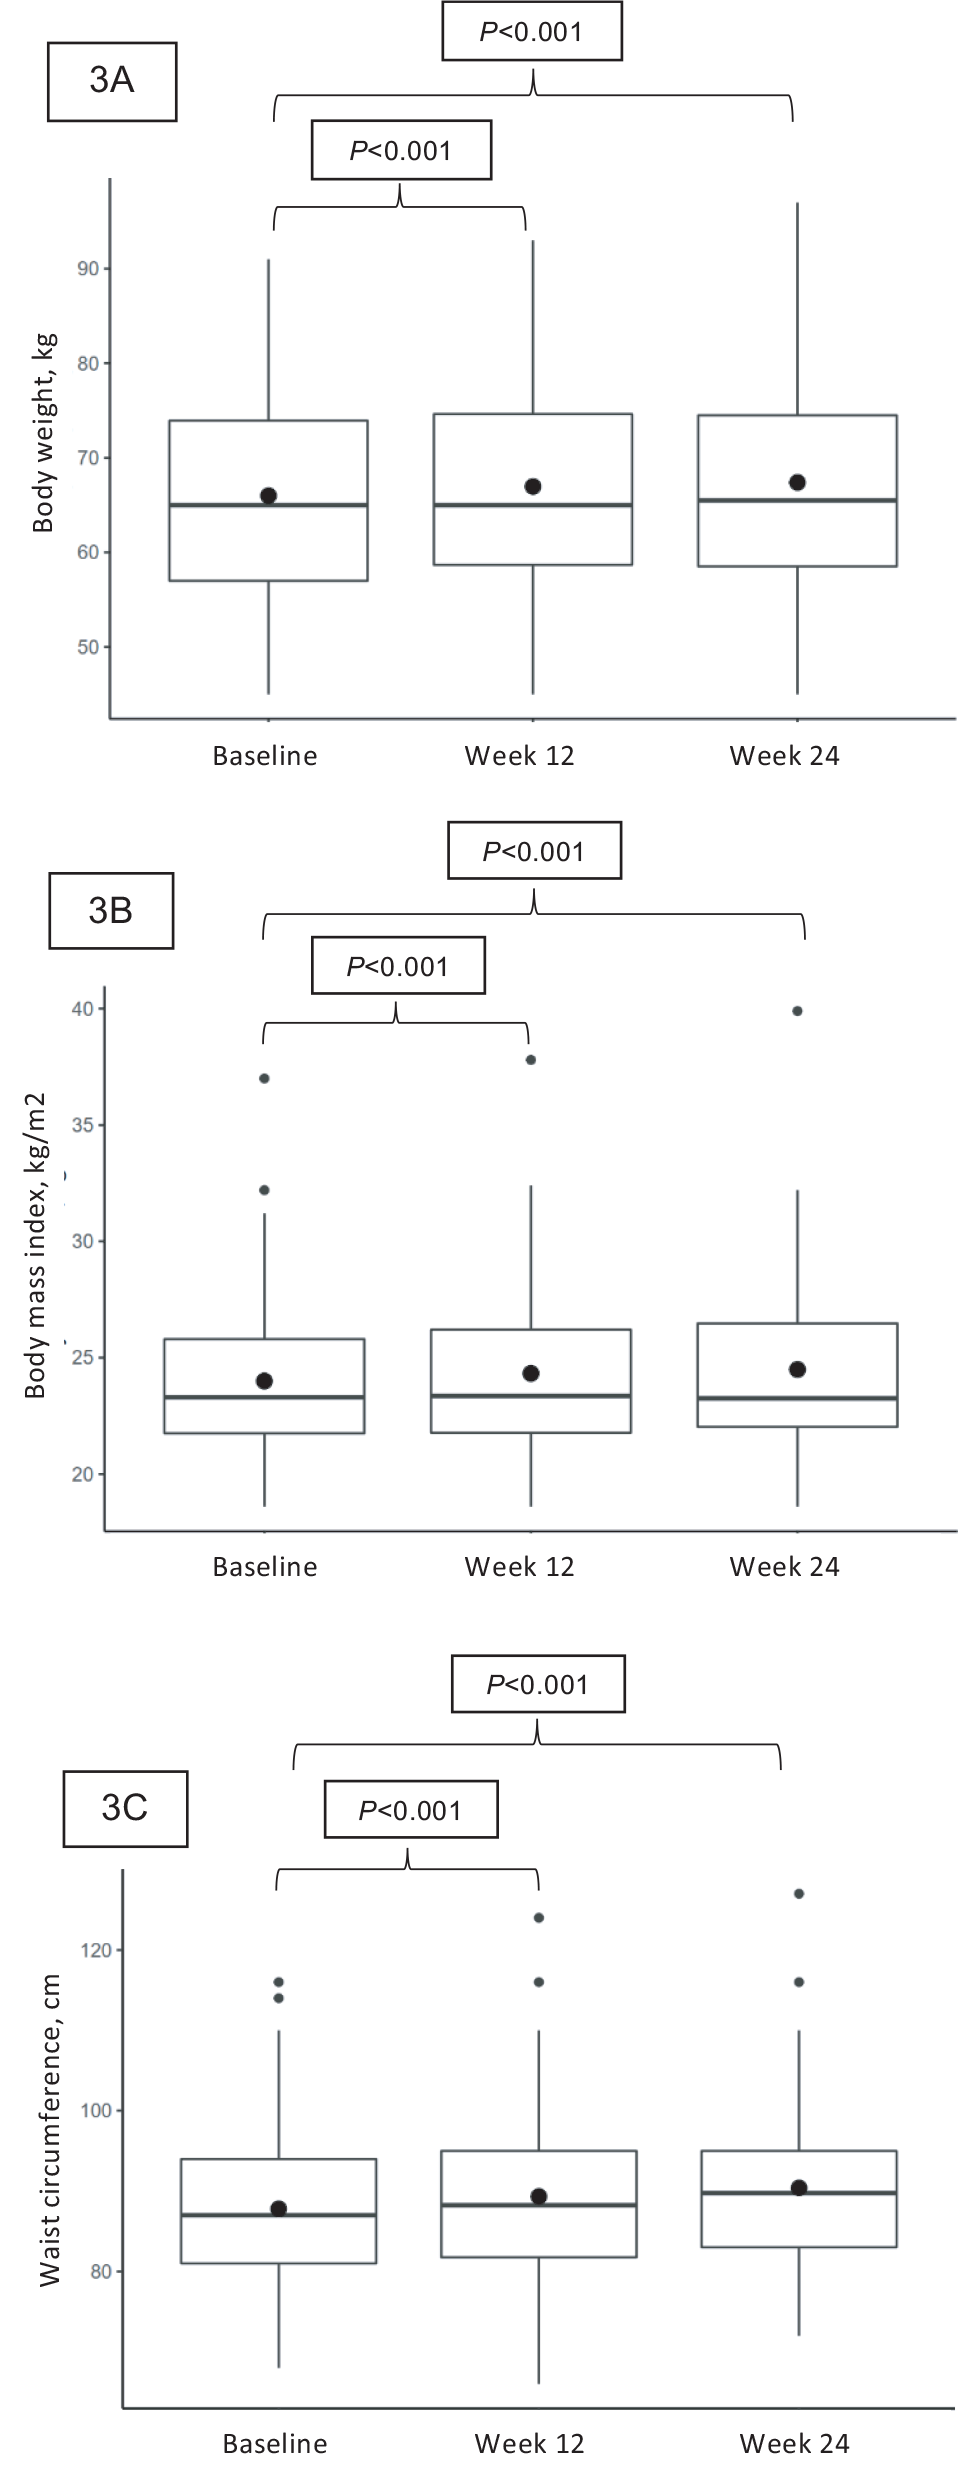
Figure 3 - Box plot of body weight, body mass index, and waist circumference change from baseline. The horizontal line in the box interior represents the group median. The large black dot represents the group mean. (3A) body weight, (3B) body mass index, (3C) waist circumference.
Virological failure is the primary issue to consider when changing treatments for patients who are already experiencing viral suppression. The cause of viral blips, which were observed in three patients within 24 weeks of transitioning to DTG in our study, is still unknown. Regimes based on INSTIs have been associated with a low frequency of viral blips and do not appear to be linked to virologic failure. However, the occurrence of these blips may increase the clinical workload (17). Therefore, these three patients must undergo further follow-up.
The potential for weight gain is another significant concern when transitioning to a DTG-based regimen (18,19,20). Our study found a substantial increase in body weight, BMI, and waist circumference after the switch. While INSTI-based regimens are generally recommended as the first-line treatment for HIV (21), recent studies have shown that people receiving these regimens for initial therapy may experience greater weight gain compared to those on protease inhibitors (PIs) or NNRTI-based regimens. For example, a cohort from Brazil found that individuals on RAL-based regimens had a sevenfold higher likelihood of developing obesity than those on NNRTI- or PI-based regimens (22). Additional observational studies have indicated that INSTI-based regimens, particular DTG-based regimens, may be linked to more significant weight gain (23,24,25,26). The NAMSAL study, which involved 613 people with HIV in Cameroon randomized to either TDF/3TC with DTG or EFV, revealed that those on the DTG-based regimen gained more weight compared to those on EFV at 48 weeks, and this weight gain was most prominent in women (27).
Furthermore, a recent analysis of eight phase III clinical trials, including 5,680 ART-naive participants, reported that 17.3% of them had a weight gain of ≥10% from baseline, and the weight gain was greater among those taking INSTIs (3.24 kg) than NNRTIs (1.93 kg) and PIs (1.72 kg) (28). Female gender and African origin were factors associated with weight gain (29). The studies conducted in the Asian population reported that factors such as low initial CD4 counts and starting treatment with DTG/TAF/FTC were associated with weight gain (30). These findings suggest that racial diversity may influence changes in body weight among people with HIV.
DTG is generally well-tolerated and appear to have less long-term adverse effects than other regimens. Some patients in this cohort had elevated creatinine values and a slight decrease in eGFR after switching to DTG, and these were significant compared to baseline. DTG has been found to cause a predictable, early increase in serum creatinine of approximately 10% of baseline values in treatment-naive patients and 14% in treatment-experienced patients. This increase is caused by the inhibition of tubular creatinine secretion through the organic cation transporter 2 (OCT2) receptor, but it does not result in a genuine decline in the eGFR (31,32).
| Laboratory parameters | N = 64; mean (SD) | |||||||||||
|---|---|---|---|---|---|---|---|---|---|---|---|---|
| Week 0 | Week 12 | Week 24 | Change from week 0 vs. 12 | p-Value | Change from week 0 vs. 24 | p-Value | Change from week 12 vs. 24 | p-Value | ||||
| Diff | 95% CI | Diff | 95% CI | Diff | 95% CI | |||||||
| Fasting blood sugar, mg/dL | 98.88 ± 12.41 | 94.23 ± 12.61 | 98.42 ± 21.35 | −4.64 ± 12.32 | −7.72, −1.56 | 0.004 | −0.45 ± 21.01 | −5.70, 4.79 | 0.864 | 4.18 ± 17.07 | −0.07, 8.45 | 0.054 |
| Creatinine, mg/dL | 0.95 ± 0.16 | 1.11 ± 0.19 | 1.11 ± 0.19 | 0.15 ± 0.11 | 0.12, 0.18 | <0.001 | 0.15 ± 0.13 | 0.11, 0.18 | 0.001 | −0.01 ± 0.13 | −0.04, 0.02 | 0.660 |
| eGFR, mL/min/1.73 m2 | 85.46 ± 22.16 | 74.92 ± 20.36 | 75.96 ± 20.47 | −10.54 ± 8.24 | −12.59, −8.47 | <0.001 | −9.50 ± 9.86 | −11.97, −7.04 | <0.001 | 1.03 ± 8.41 | −1.07, 3.13 | 0.330 |
| Hemoglobin, g/dL | 13.84 ± 2.09 | 13.94 ± 1.97 | 14.13 ± 2.04 | 0.11 ± 0.88 | −0.11, 0.32 | 0.340 | 0.29 ± 0.84 | 0.08, 0.51 | 0.007 | 0.19 ± 0.71 | 0.01, 0.37 | 0.038 |
| Albumin, g/dL | 4.76 ± 0.41 | 4.68 ± 0.25 | 4.63 ± 0.28 | −0.07 ± 0.35 | −0.16, 0.01 | 0.079 | −0.12 ± 0.35 | −0.21, −0.03 | 0.006 | −0.04 ± 0.21 | −0.10, 0.01 | 0.090 |
| Globulin, g/dL | 3.05 ± 0.36 | 2.91 ± 0.41 | 3.02 ± 0.39 | −0.14 ± 0.30 | −0.21, −0.06 | <0.001 | −0.02 ± 0.29 | −0.10, 0.04 | 0.442 | 0.11 ± 0.34 | 0.03, 0.20 | 0.009 |
| Alanine aminotransferase, U/L | 36.78 ± 23.78 | 34.38 ± 27.68 | 31.17 ± 16.46 | −2.41 ± 23.99 | −8.4, 3.58 | 0.425 | −5.61 ± 23.52 | −11.48, 0.26 | 0.061 | −3.20 ± 21.72 | −8.62, 2.22 | 0.243 |
| Aspartate aminotransferase, U/L | 32.13 ± 19.65 | 29.08 ± 15.17 | 28.61 ± 10.29 | −3.04 ± 17.52 | −7.42, 1.33 | 0.169 | −3.51 ± 18.94 | −8.24, 1.21 | 0.143 | −0.46 ± 12.18 | −3.51, 2.57 | 0.759 |
| Alkaline phosphatase, U/L | 105.86 ± 31.35 | 86.11 ± 25.72 | 85.92 ± 26.25 | −19.75 ± 17.17 | −24.04, −15.46 | <0.001 | −19.93 ± 17.94 | −24.42, −15.45 | <0.001 | −0.18 ± 10.81 | −2.88, 2.51 | 0.890 |
eGFR = estimated glomerular filtration rate; SD = standard deviation.
This is the first prospective cohort study to examine the consequences of switching from EFV to DTG in people with HIV with dyslipidemia in Thailand. Our data confirm that the use of DTG is safe and adverse effects are rare in this population.
There were a few limitations to this study. Firstly, it was a single-arm, monocentric study, and open-label study. Additionally, the sample size was relatively small. Furthermore, since the follow-up duration was brief, some effects may not have been detectable yet. Finally, as patients were aware when their blood lipids were high, they may have engaged in lifestyle modification, such as diet and exercise, regardless of any adjustments to their medication regimen.
Conclusions
The study showed that switching from EFV-based therapy to DTG improved lipid profiles, suggesting that this switch could benefit patients with a high risk of cardiovascular disease. However, it is essential to note that weight gain and increased waist circumference were also observed.
Acknowledgments
The authors gratefully acknowledge those involved in this research, including associated professor Piroon Mootsikapun and associate professor Siriluck Anunnatsiri. Thanks also to Dr. Dylan Southard for editing this manuscript via the KKU Publication Clinic (Thailand). Most of all, we would like to thank the patients who accepted to participate in this study.
Trial Registration: Thai Clinical Trials Registry, TCTR20221118002.
Disclosures
Conflict of interest: The authors declare no competing interests.
Financial support: The Research Affairs division of the Khon Kaen University Faculty of Medicine funded this study.
Authors’ contributions: All authors participated in the study, contributed to manuscript preparation, and reviewed the manuscript. PC contributed to the conception and design. SK, AM, and WS designed the study, analyzed data, and drafted the manuscript.
References
- 1. So-Ngern A, Khan-Asa B, Montakantikul P, Manosuthi W. Dyslipidemia among Thai HIV-infected adults receiving antiretroviral therapy: a hospital-based report. Southeast Asian J Trop Med Public Health. 2018;49(1):60-67. Available at Online. Accessed March 2023.
- 2. Friis-Møller N, Weber R, Reiss P, et al; DAD study group. Cardiovascular disease risk factors in HIV patients – association with antiretroviral therapy. Results from the DAD study. AIDS. 2003;17(8):1179-1193. CrossRef PubMed
- 3. Maggi P, Bellacosa C, Carito V, et al. Cardiovascular risk factors in patients on long-term treatment with nevirapine- or efavirenz-based regimens. J Antimicrob Chemother. 2011;66(4):896-900. CrossRef PubMed
- 4. Rockstroh JK, Lennox JL, Dejesus E, et al; STARTMRK Investigators. Long-term treatment with raltegravir or efavirenz combined with tenofovir/emtricitabine for treatment-naive human immunodeficiency virus-1-infected patients: 156-week results from STARTMRK. Clin Infect Dis. 2011;53(8):807-816. CrossRef PubMed
- 5. Thamrongwonglert P, Chetchotisakd P, Anunnatsiri S, Mootsikapun P. Improvement of lipid profiles when switching from efavirenz to rilpivirine in HIV-infected patients with dyslipidemia. HIV Clin Trials. 2016;17(1):12-16. CrossRef PubMed
- 6. Ruxrungtham K, Puthanakit T, Putacharoen O, et al. Thailand National Guidelines on HIV/AIDS Treatment and Prevention 2017. Nonthaburi: Division of AIDS and STIs, Department of Disease Control; 2017. Available at Online. Accessed March 2023.
- 7. World Health Organization. Update of Recommendations on First- and Second-Line Antiretroviral Regimens. Policy brief: World Health Organization; 2019. Available at Online. Accessed March 2023.
- 8. Taramasso L, Ricci E, Menzaghi B, et al; CISAI Study Group. A CISAI Study Group. Weight gain: a possible side effect of all antiretrovirals. Open Forum Infect Dis. 2017;4(4):ofx239. CrossRef PubMed
- 9. Ruxrungtham K, Chokephaibulkit K, Chetchotisakd P, et al. Thailand National Guidelines on HIV/AIDS Treatment and Prevention 2021/2022. Nonthaburi: Division of AIDS and STIs, Department of Disease Control; 2022. Available at Online. Accessed March 2023.
- 10. Quercia R, Roberts J, Martin-Carpenter L, Zala C. Comparative changes of lipid levels in treatment-naive, HIV-1-infected adults treated with dolutegravir vs. efavirenz, raltegravir, and ritonavir-boosted darunavir-based regimens over 48 weeks. Clin Drug Investig. 2015;35(3):211-219. CrossRef PubMed
- 11. Walmsley SL, Antela A, Clumeck N, et al; SINGLE Investigators. Dolutegravir plus abacavir-lamivudine for the treatment of HIV-1 infection. N Engl J Med. 2013;369(19):1807-1818. CrossRef PubMed
- 12. van Lunzen J, Maggiolo F, Arribas JR, et al. Once daily dolutegravir (S/GSK1349572) in combination therapy in antiretroviral-naive adults with HIV: planned interim 48 week results from SPRING-1, a dose-ranging, randomised, phase 2b trial. Lancet Infect Dis. 2012;12(2):111-118. CrossRef PubMed
- 13. National Cholesterol Education Program (NCEP) Expert Panel on Detection, Evaluation, and Treatment of High Blood Cholesterol in Adults (Adult Treatment Panel III). Third Report of the National Cholesterol Education Program (NCEP) Expert Panel on Detection, Evaluation, and Treatment of High Blood Cholesterol in Adults (Adult Treatment Panel III) final report. Circulation. 2002;106(25):3143-3421. CrossRef PubMed
- 14. Taramasso L, Tatarelli P, Ricci E, et al; CISAI Study Group. Improvement of lipid profile after switching from efavirenz or ritonavir-boosted protease inhibitors to rilpivirine or once-daily integrase inhibitors: results from a large observational cohort study (SCOLTA). BMC Infect Dis. 2018;18(1):357-364. CrossRef PubMed
- 15. Pozniak A, Markowitz M, Mills A, et al. Switching to coformulated elvitegravir, cobicistat, emtricitabine, and tenofovir versus continuation of non-nucleoside reverse transcriptase inhibitor with emtricitabine and tenofovir in virologically suppressed adults with HIV (STRATEGY-NNRTI): 48 week results of a randomised, open-label, phase 3b non-inferiority trial. Lancet Infect Dis. 2014;14(7):590-599. CrossRef PubMed
- 16. Saumoy M, Sanchez-Quesada JL, Ordoñez-Llanos J, Podzamczer D. Do all integrase strand transfer inhibitors have the same lipid profile? Review of randomised controlled trials in naïve and switch scenarios in HIV-infected patients. J Clin Med. 2021;10(16):3456. CrossRef PubMed
- 17. Dijkstra S, Hofstra LM, Mudrikova T, et al. Lower incidence of HIV-1 blips was observed during integrase inhibitor-based combination antiretroviral therapy. J Acquir Immune Defic Syndr. 2022;89(5):575-582. CrossRef PubMed
- 18. Koethe JR, Jenkins CA, Lau B, et al; North American AIDS Cohort Collaboration on Research and Design (NA-ACCORD). Rising obesity prevalence and weight gain among adults starting antiretroviral therapy in the United States and Canada. AIDS Res Hum Retroviruses. 2016;32(1):50-58. CrossRef PubMed
- 19. Hasse B, Iff M, Ledergerber B, et al; Swiss HIV Cohort Study. Obesity trends and body mass index changes after starting antiretroviral treatment: the Swiss HIV Cohort Study. Open Forum Infect Dis. 2014;1(2):ofu040. CrossRef PubMed
- 20. Eckard AR, McComsey GA. Weight gain and integrase inhibitors. Curr Opin Infect Dis. 2020;33(1):10-19. CrossRef PubMed
- 21. Panel on Antiretroviral Guidelines for Adults and Adolescents Guidelines for the use of antiretroviral agents in HIV-1-infected adults and adolescents. Department of Health and Human Services, 2023. Available at Online. Accessed March 2023.
- 22. Bakal DR, Coelho LE, Luz PM, et al. Obesity following ART initiation is common and influenced by both traditional and HIV-/ART-specific risk factors. J Antimicrob Chemother. 2018;73(8):2177-2185. CrossRef PubMed
- 23. Bourgi K, Rebeiro PF, Turner M, et al. Greater weight gain in treatment-naive persons starting dolutegravir-based antiretroviral therapy. Clin Infect Dis. 2020;70(7):1267-1274. CrossRef PubMed
- 24. Menard A, Meddeb L, Tissot-Dupont H, et al. Dolutegravir and weight gain: an unexpected bothering side effect? AIDS. 2017;31(10):1499-1500. CrossRef PubMed
- 25. Rizzardo S, Lanzafame M, Lattuada E, et al. Dolutegravir monotherapy and body weight gain in antiretroviral naïve patients. AIDS. 2019;33(10):1673-1674. CrossRef PubMed
- 26. Norwood J, Turner M, Bofill C, et al. Brief report: weight gain in persons with HIV switched from efavirenz-based to integrase strand transfer inhibitor-based regimens. J Acquir Immune Defic Syndr. 2017;76(5):527-531. CrossRef PubMed
- 27. Kouanfack C, Mpoudi-Etame M, Omgba Bassega P, et al; NAMSAL ANRS 12313 Study Group. Dolutegravir-based or low-dose efavirenz-based regimen for the treatment of HIV-1. N Engl J Med. 2019;381(9):816-826. CrossRef PubMed
- 28. Sax PE, Erlandson KM, Lake JE, et al. Weight gain following initiation of antiretroviral therapy: risk factors in randomized comparative clinical trials. Clin Infect Dis. 2020;71(6):1379-1389. CrossRef PubMed
- 29. Kanters S, Renaud F, Rangaraj A, et al. Evidence synthesis evaluating body weight gain among people treating HIV with antiretroviral therapy – a systematic literature review and network meta-analysis. EClinicalMedicine. 2022;48:101412. CrossRef PubMed
- 30. Ando N, Nishijima T, Mizushima D, et al. Long-term weight gain after initiating combination antiretroviral therapy in treatment-naïve Asian people living with human immunodeficiency virus. Int J Infect Dis. 2021;110:21-28. CrossRef PubMed
- 31. Milburn J, Jones R, Levy JB. Renal effects of novel antiretroviral drugs. Nephrol Dial Transplant. 2017;32(3):434-439. PubMed
- 32. Osterholzer DA, Goldman M. Dolutegravir: a next-generation integrase inhibitor for treatment of HIV infection. Clin Infect Dis. 2014;59(2):265-271. CrossRef PubMed