|
Arch Physioter 2025; 15: 9-18 ISSN 2057-0082 | DOI: 10.33393/aop.2025.3289 ORIGINAL RESEARCH ARTICLE |
Discriminative ability, responsiveness, and interpretability of smoothness index of gait in people with multiple sclerosis
Stefano Filippo Castiglia![]() 1,2, Fulvio Dal Farra
1,2, Fulvio Dal Farra![]() 3, Dante Trabassi
3, Dante Trabassi![]() 1, Andrea Turolla
1, Andrea Turolla![]() 4,5, Mariano Serrao
4,5, Mariano Serrao![]() 1,6, Ugo Nocentini
1,6, Ugo Nocentini![]() 7, Paolo Brasiliano
7, Paolo Brasiliano![]() 8, Elena Bergamini
8, Elena Bergamini![]() 9, Marco Tramontano
9, Marco Tramontano![]() 4,5
4,5
ABSTRACT
Introduction: Gait impairments are common in People with Multiple Sclerosis (PwMS). Several studies have examined the clinometric properties of Inertial Measurement Units (IMUs), with LDLJa identified as a robust metric for gait smoothness. However, its responsiveness and interpretability have not been explored.
Methods: This cross-sectional study at IRCCS Santa Lucia Hospital enrolled 44 PwMS (age: 28-71; EDSS: 0-6) and 43 age- and gait-speed-matched healthy participants (HP). Two physiotherapists conducted assessments with five synchronized IMUs during a 10-meter walk at participants’ preferred speed. Data were collected at baseline (T0) and after 4 weeks of training (T1).
Results: Significant differences in log dimensionless jerk (LDLJa) were found between PwMS and HP in the AP (p < 0.001, d = 0.63), ML (p < 0.001, d = 1.08), and CC (p = 0.03, d = 0.68) directions. PwMS had lower LDLJaAP values (< -4.88) and LDLJaML values (< -5.40) with probabilities of 63% and 76%, respectively. ΔLDLJaML demonstrated good responsiveness to rehabilitation (AUC ~0.80), with improvements >4.02% representing the optimal MCID for clinical improvement in MiniBesTest.
Conclusion: Lower LDLJa values in the AP and ML directions characterize gait smoothness impairment in PwMS. LDLJa in the ML direction is responsive to balance-focused rehabilitation, highlighting its potential for tracking gait disorders and rehabilitation progress.
Keywords: IMUs, Sensor, Multiple sclerosis, Responsiveness, Smoothness, Gait
Received: September 4, 2024
Accepted: December 29, 2024
Published online: February 3, 2025
Study protocol number: received approval from the Local Independent Ethics Committee (CE/PROG.812)
Corresponding author:
Fulvio Dal Farra
email: fulvio.dalfarra@unibs.it
Archives of Physiotherapy - ISSN 2057-0082 - www.archivesofphysiotherapy.com
© 2025 The Authors. This article is published by AboutScience and licensed under Creative Commons Attribution-NonCommercial 4.0 International (CC BY-NC 4.0).
Commercial use is not permitted and is subject to Publisher’s permissions. Full information is available at www.aboutscience.eu
Key messages:
- What is already known about this topic: A series of trunk-acceleration-derived gait quality indexes are considered effective for assessing gait characteristics such as stability, symmetry, and smoothness in different populations, including patients with multiple sclerosis.
What does the study add:
- This study highlights the potential of smoothness index “LDLJa” to serve as a reliable and responsive measure for characterizing gait disorders and tracking rehabilitation progress in patients with multiple sclerosis.
Introduction
Gait and balance impairments represent frequent issues in people with multiple sclerosis (PwMS), leading to limitations in daily activities and negatively impacting quality of life (1,2). In rehabilitation, gait training has proven to be effective in PwMS, improving gait speed, cadence, stride-to-stride variability, endurance, and postural stability. In this context, the quantitative assessment of the different gait-specific aspects is important and crucial (3,4).
In recent years, the use of wearable IMUs has become widespread in the clinical field due to their good reliability and validity in assessing human body movement (5), as well as their valuable properties in terms of practicability and cost-effectiveness (6). IMUs are motion-tracking devices consisting of an accelerometer, gyroscope, and (in some cases) magnetometer, which measure acceleration, angular velocity, and magnetic fields, allowing for the determination of motion and orientation.
In this context, several studies have investigated the clinometric properties of IMU sensors, obtaining satisfactory results in both healthy individuals and patients with neurological disorders (7,8).
A series of trunk-acceleration derived gait quality indexes can be retrieved from IMUs, that yield crucial information for evaluating motor abilities and monitoring recovery progress. Specifically, the normalized Root Mean Square, the short–term Lyapunov’s exponent, the Harmonic ratio, the improved Harmonic Ratio, and the Log Dimensionless Jerk (LDLJ), obtained from trunk acceleration signals, are considered effective for assessing gait characteristics such as stability, symmetry, and smoothness in different populations (9-12), including PwMS (13,14). Recently, LDLJa (15), i.e., LDLJ calculated using the three-dimensional accelerations measured using a trunk-mounted IMU during a 10 Meter-Walk-Test (10MWT), has proven to be able to detect gait differences in terms of smoothness, in PwMS (16). Furthermore, LDLJa significantly improved after a rehabilitation program focusing on dynamic balance rehabilitation strategies (17). LDLJa has been described as the most robust metric for calculating gait smoothness (15,18). Indeed, it quantifies gait smoothness by calculating a normalized measure of the rate of change of acceleration that is dimensionless and scaled using the logarithm, thus removing the influence of movement duration and amplitude, allowing for comparisons across individuals and movement types (15). Gait smoothness has been described as an indicator of dynamic balance capabilities and fall risk in older adults and people with neurologic conditions (18-22). This relationship between gait smoothness and balance control is particularly relevant in people with neurological disorders, as smoothness reflects the efficiency of the neuromuscular system in coordinating motor tasks, which is closely linked to balance control (22). Additionally, a recent study revealed that balance-focused dynamic rehabilitation strategies can significantly modify gait smoothness (23). However, its discriminative ability, as well as its threshold values for identifying impairments in the gait smoothness of PwMS, has never been explored. Nevertheless, before considering LDLJa as a clinical outcome measure, its responsiveness should be assessed, which refers to its ability to change over time and align with clinical modifications after a rehabilitation intervention (24,25).
In this context, one of the most considered parameters is the Minimal Clinically Important Difference (MCID), also known as minimal important change, which is defined as the smallest change in a measure perceived as beneficial by individuals and potentially leading to different clinical decision-making (26). This definition implies that this change needs to be perceived by both clinicians and individuals. Studying the MCID could be useful for healthcare providers as it provides a benchmark to determine whether a patient’s improvement or decline is clinically meaningful. This may help clinicians to make informed decisions about the effectiveness of interventions and to tailor rehabilitation programs more precisely to individual needs (27). There is no consensus on the best method to determine MCID, but the anchor-based approach is widely recognized. It uses an external criterion (the anchor), which is a well-interpretable measurement instrument, to establish what patients and clinicians consider important improvements or worsening. A commonly employed method in the anchor-based approach is the mean change, where the MCID is determined by calculating the average change in score on the assessed instrument within the subgroup of patients who have experienced minimal important change according to the anchor.
Our hypotheses were that LDLJa may accurately capture abnormalities in movement smoothness and reflect the overall postural and balance control of PwMS. We also hypothesized that LDLJa might be sensitive enough to detect clinically meaningful improvements in movement smoothness following rehabilitation. Therefore, the aims of this study were: i) to assess the ability of LDLJa to characterize gait abnormalities in PwMS in terms of movement smoothness, compared with HP; ii) to evaluate the sensitivity of LDLJa in detecting significant improvements in movement smoothness in PwMS performing the 10 Meter-Walk-Test (10MWT) following rehabilitation.
Materials and methods
Study design and participants
This cross-sectional study was conducted at the IRCCS Santa Lucia Hospital (Institute for Research and Healthcare) and received approval from the Local Independent Ethics Committee under protocol number CE/PROG.812. All procedures adhered to national and institutional ethical standards for human experimentation, the World Medical Association Declaration of Helsinki, and the Strengthening the Reporting of Observational Studies in Epidemiology (STROBE) guidelines. Written consent was obtained from all participants to publish results from their clinical examinations and instrumental tests. Eligibility was determined by a researcher not involved in the assessment sessions, based on specific inclusion and exclusion criteria. Participants with MS diagnosed according to the McDonald’s Criteria were recruited and enrolled through consecutive sampling between November 2020 and October 2022.
The inclusion criteria were as follows: i) a diagnosis of Relapsing-Remitting (RR) or Secondary-Progressive (SP) MS by an experienced neurologist; ii) native Italian speakers; iii) age between 28 and 71 years; iv) an Expanded Disability Status Scale (EDSS) (28) score between 0 and 6; v) ability to walk independently for at least 50 meters. Exclusion criteria included: i) the presence of psychiatric or neurological disorders (other than MS) or other conditions that could affect cognitive or motor performance; ii) a clinical relapse within three months prior to enrollment; iii) steroid therapies within 30 days prior to enrollment; iv) lower extremity fractures within three months prior to enrollment.
Each participant underwent a clinical evaluation using the Mini-BESTest, which assessed dynamic balance, postural responses, anticipatory postural adjustments, sensory orientation, and gait adaptability to changing task demands (29). As a result, data from 44 PwMS were analyzed.
For comparison purposes, gait data from 98 healthy individuals walking at preferred and self-determined slow walking speeds underwent an optimal matching the procedure using propensity score difference method (30). Age and gait speed (31,32) were input as covariates into a logistic regression model to compute propensity scores. Following an anamnestic and clinical examination of joint pain levels and range of motion, individuals with gait-affecting diseases such as peripheral neuropathies, clinically defined osteoarthritis, or joint replacement were excluded from the control group. As a result, gait data from 43 age- and gait speed–matched HP were included in this study. The effectiveness of the matching procedure was tested through a Mann – Whitney test after verifying the normality and homoscedasticity of the distributions through the Shapiro – Wilk test (Age: p = 0.09; gait speed: p = 0.29; sex: p = 0.36).
Sample size
A priori analysis of sample size was conducted using G*Power Version 3.1.9.4 software. Considering two groups and two repeated assessments, an effect size of 0.6, a type I error probability of 0.05, and a power effect of 0.80, the minimum required group size was 24 PwMS, accounting for dropouts (10%).
Data Collection
To ensure high-quality data, raters underwent specialized training to administer clinical outcome measures and conduct kinematic assessments. IMUs were securely attached to relevant body segments with Velcro straps to minimize oscillations and reduce motion artifacts. Two physiotherapists experienced in gait analysis with IMUs conducted the instrumental assessment and remained close to each participant during tests to prevent falls and ensure proper execution.
IMU-derived indices were measured as participants walked at their preferred gait speed along a 10-meter path, with an additional 2 meters at each end for turning, resulting in a total walking distance of 14 meters. (Fig. 1). Each task was performed three times, of which the mean value between trials was subsequently calculated and used for the statistical analysis. Data were collected at baseline (T0) and after 4 weeks of training (T1).
Participants were equipped with five synchronized IMUs (128 Hz, Opal, APDM, Portland, OR, USA), which acquired samples of three-dimensional linear accelerations and angular velocities. IMUs were located on the occipital cranium bone, near the lambdoid suture of the head (H), at the center of the sternum (S). For calculating the LDLJa, data from a single IMU placed at the L4/L5 level, just above the pelvis (P), was utilized. To segment steps and strides, data from the IMUs positioned on each lower leg, just above the lateral malleoli, were considered (33). During the initial static phase of each trial, a reference system aligned with the gravity vector was obtained. The time-invariant rotational matrix between each IMU and the defined reference system was computed and applied to the dynamic phase of the trials. As a result, accelerometer and gyroscope data were represented in a reference system roughly aligned with the antero-posterior (AP), medio-lateral (ML), and cranio-caudal (CC) anatomical axes. This method removed the acceleration due to gravity from the CC component of the accelerometer data (34). The accelerometer and gyroscope data were filtered using a second-order Butterworth low-pass filter with cutoff frequencies of 10 Hz and 6 Hz, respectively. Data were processed in the MATLAB® environment (MATLAB R2022b, MathWorks) for the computation of the LDLJa.
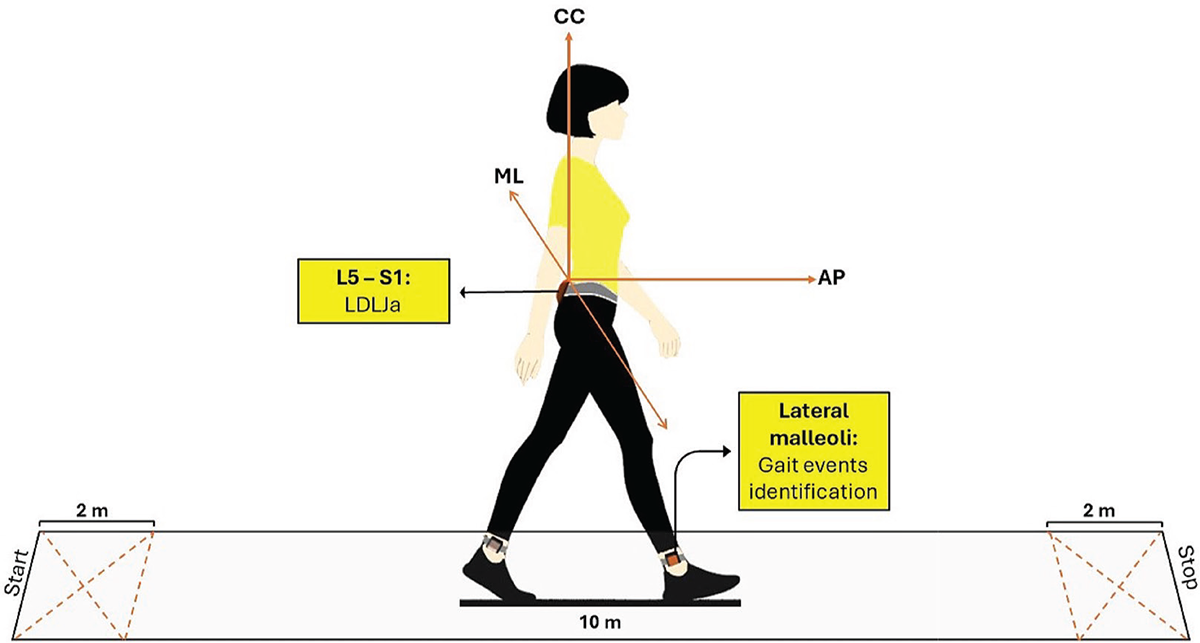
FIGURE 1 - Data collection procedure. IMU-derived indices recorded as participants walked at their gait speed along a 10-meter straight path, with an additional 2 meters at each end for turning, resulting in a total walking distance of 14 meters.
The LDLJ was calculated at the pelvis level from the linear acceleration signals for each spatial direction according to the following formula (15):

where a(t) represents the time – domain acceleration of a movement, a normalization factor based on the peak of the acceleration profile apeak, and t1, t2 are the start and stop times of the movement, respectively.
Interventions
The enrolled patients underwent 12 individual sessions of either conventional or cognitive-motor training, scheduled 3 days per week over a period of 4 weeks. Each session lasted 50 minutes. The conventional neuromotor rehabilitation program included 30 minutes of muscle stretching, active-assisted mobilizations, neuromuscular facilitation, gait training, and balance exercises using swinging platforms. Additionally, 20 minutes of dynamic postural stability training involved marching on unstable surfaces and walking on the treadmill with both open and closed eyes. For the cognitive-motor intervention, 20 minutes of treatment was incorporated into the conventional therapy. This involved a dual-task paradigm where each patient was instructed to walk continuously and respond to auditory stimuli by turning their head toward the sound and identifying a visual target. This dual task was performed while marching on an unstable surface and walking on the treadmill at varying velocities (23). The interventions were performed by physiotherapists not involved in the assessment.
Data analysis
After verifying the normality of the distributions through the Shapiro – Wilk test an independent sample t-test was used to identify significant differences between PwMS and HP at T0, and a paired samples t-test or Wilcoxon test was used to identify significant changes a T1, as well as Cohen’s d with Hedge’s correction was calculated to assess effect size.
Changes in gait variables and MiniBesTest scores at T1 were expressed as delta (∆) values according to the following formula:
Δ = (T1 – T0)/T0 *100
Partial Spearman’s correlation coefficient (ρ) accounting for tied scores and excluding the effects of EDSS values and gait speed were calculated to assess the correlation between the LDLJa and MiniBesTest at T0 as well as between the improvements in LDLJa and MiniBesTest.
Two logistic regression models were trained to predict binary outcomes using LDLJa scores at T0 and ΔLDLJa levels as the predictor variable with the following aims: i) to assess the ability of LDLJa to characterize the gait abnormalities of PwMS at T0 compared with HP as well as determining the related optimal cutoff value to characterize lower trunk smoothness abnormalities; ii) to assess the external responsiveness of LDLJa by using an improvement in MiniBesTest based on scores > 4 at T1 as anchor in PwMS who reported LDLJa abnormal values at T0.
To optimize and assess model performance, stratified k-fold cross-validation was implemented. This method ensured that the proportion of the two classes was maintained within each fold (35). For each iteration of cross-validation, the sample was partitioned into 5 folds. In each iteration, one fold was used as the validation set, and the remaining k-1 folds were used to train the model. Each sample was used once in the validation set and k-1 times in the training set across the k iterations. Therefore, a subject included in the validation fold in any given iteration was not included in the training folds during that same iteration (36). As a result, in the first model, the cross-validation procedure included 69 participants in the training sets and 17 participants in the validation sets for each iteration. The second model used 34 pwMS for training and 10 pwMS for validating each iteration.
To address the class imbalance between pwMS and HP, as well as between improved and non-improved PwMS, the Synthetic Minority Over-sampling Technique (SMOTE) was applied exclusively to the training data in each fold (6,37). Receiver Operating Characteristic (ROC) curves were plotted for each fold, and bootstrapping was used to estimate the 95% confidence intervals (38). The optimal cut-off point (OCP) for classifying PwMS from HP, as well as the MCID score reflecting an improvement ≥ 4 in the MiniBEsTest score (29), were determined as the values that maximized the sum of sensitivity and specificity. After cross-validation, the OCPs and MCIDs obtained from the training fold were then applied to the validation fold set to evaluate the model’s performance on unseen data. Sensitivity (Se), specificity (Sp), AUC, F1 score, precision, and positive and negative likelihood ratios (LR+ and LR-, respectively), were calculated for both the training and validation sets within each fold and for the test set at the optimal thresholds. Likelihood ratios were transformed into positive and negative likelihood ratios (PTP+ and PTP-, respectively) through a Fagan’s nomogram. The performance metrics were averaged across all folds to provide an overall assessment of the model (39). Additionally, the final optimal threshold was calculated as the mean of the optimal thresholds determined in each fold.
Results
IMU-measures were obtained from forty-four PwMS. Twenty-one participants were allocated to the conventional group, and 23 to the cognitive-motor group. The two groups were homogeneous with respect to demographic and anthropometric characteristics, and clinical status. Clinical and demographic characteristics of the 44 participants are described in Table 1. Two participants of the cognitive-motor group dropped out for reasons not related to the study, and data from 21 participants for each group were analyzed at T1.
| PwMS (n = 44) |
HP (n = 43) | ||
|---|---|---|---|
| Disease duration, years [mean (SD)] | 12.93 (9.73) | ||
| EDSS [mean (SD)] | 4.19 (1.58) | ||
| MiniBesTest [mean (SD)] | T0 | 18.73 (6.75) | |
| T1 | 20.78 (6.06) | ||
| Age, years [mean (SD)] | 49.76 (11.08) | 57.57 (10.69) | |
| Sex [n (%)] | F | 12 (30 %) | 17 (39.53 %) |
| M | 28 (70 %) | 26 (60.46 %) | |
| Gait speed (m/s) | T0 | 0.94 (0.37) | 1.06 (0.23) |
| T1 | 1.10 (0.39) | ||
| LDLJaAP [mean (SD)] | T0 | –5.22 (0.39) | –4.92 (0.46) |
| T1 | –5.17 (0.33) | ||
| LDLJaML [mean (SD)] | T0 | –5.48 (0.31) | –5.21 (0.24) |
| T1 | –5.29 (0.28) | ||
| LDLJaCC [mean (SD)] | T0 | –5.06 (0.43) | –5.02 (0.38) |
| T1 | –5.02 (0.33) | ||
PwMS, people with multiple sclerosis; HP, age and gait speed – matched healthy participants; EDSS, expanded disability status scale; SD, standard deviation; T0, assessment at baseline; T1, assessment following the rehabilitation period; LDLJa, log-dimensionless jerk score of acceleration signals; AP, antero-posterior direction of the acceleration signal; ML, medio-lateral direction of the acceleration signal; CC, cranio – caudal direction of the acceleration signal.
Ability to characterize gait smoothness differences of PwMS compared with HP
Significant differences between PwMS and HP were found in LDLJaAP (p < 0.001, d = 0.63), LDLJaML (p < 0.001; d = 1.08), and LDLJaCC (p = 0.03, d = 0.68). LDLJaAP and LDLJaML showed sufficient – to – moderate ability to identify the gait smoothness differences of PwMS compared with HP (Table 2). Lower LDLJaAP than –4.88 and lower LDLJaML values than –5.40 characterize PwMS with about 63% and 76% probability, respectively. The mean ROC curves, along with the confidence intervals and individual fold ROC curves, are shown in Fig. 2. The performance metrics are reported in Table 2. LDLJaCC did not reveal satisfactory discriminative ability, as shown by the AUC values around 0.50. Therefore, performance metrics and cutoff analysis were not conducted.
| AUC (95% CI) | OCP | Se (95% CI) | Sp (95% CI) | F1 score (95% CI) | LR+ (95% CI) | LR-(95% CI) | PTP+ | PTP- | ||
|---|---|---|---|---|---|---|---|---|---|---|
| LDLJaAP | Training folds |
0.67 (0.64–0.69) |
–4.88 | 0.87 (0.79–0.95) |
0.49 (0.43–0.56) |
0.73 (0.71–0.76) |
1.73 (1.66–1.81) |
0.25 (0.15–0.34) |
63% | 20% |
| Validation folds |
0.67 (0.56–0.78) |
0.86 (0.73–0.98) |
0.37 (0.24–0.51) |
0.68 (0.62–0.74) |
1.40 (1.26–1.54) |
0.41 (0.26–0.52) |
58% | 29% | ||
| LDLJaML | Training folds |
0.74 (0.70–0.78) |
–5.40 | 0.65 (0.55–0.76) |
0.75 (0.63–0.89) |
0.69 (0.65–0.72) |
3.20 (2.20–4.75) |
0.46 (0.42–0.50) |
76% | 32% |
| Validation folds |
0.73 (0.54–0.91) |
0.53 (0.23–0.84) |
0.74 (0.41–0.99) |
0.56 (0.32–0.81) |
2.17 (1.47–3.05) |
0.67 (0.55–0.82) |
68% | 40% | ||
| LDLJaCC | Training folds |
0.50 (0.42–0.58) |
n.a | n.a | n.a | n.a | n.a | n.a | n.a | n.a |
| Validation folds |
0.39 (0.22–0.55) |
|||||||||
AUC,area under the receiver operating characteristics curve; OCP, optimal cutoff point; Se, sensitivity; Sp, specificity; CI, confidence intervals; LR+, positive likelihood ratio; LR-, negative likelihood ratio; PTP+, positive post- test probability; PTP-, negative post – test probability; n.a., cutoff analysis not applicable because of the insufficient discriminative ability.
LDLJaML correlated with MiniBesTest values at T0, regardless of EDSS and gait speed values (ρ = 0.35, p = 0.03). LDLJaAP (ρ = 0.23, p = 0.10) and LDLJaCC ((ρ = 0.03, p = 0.79) did not reveal a significant correlation with MiniBesTest values.
Responsiveness findings
Significant differences between T0 and T1 were found in LDLJaML (Fig. 3) and MiniBesTest (p < 0.001; d = 0.68), with LDLJaML values approaching HP values at T1. No significant differences between T0 and T1 were found in LDLJaAP (p = 0.44, d = 0.12). ΔLDLJaML correlated with ΔMiniBesTest (ρ = 0.54, p < 0.00). Fifteen individuals (26%) improved their MiniBesTest scores ≥ 4 points after rehabilitation. ΔLDLJaML showed good external responsiveness to rehabilitation (AUC = around 0.80, Fig. 4) with improvements >4.02 % representing the optimal MCID to reflect a clinical improvement in MiniBesTest, as reported in Table 3.
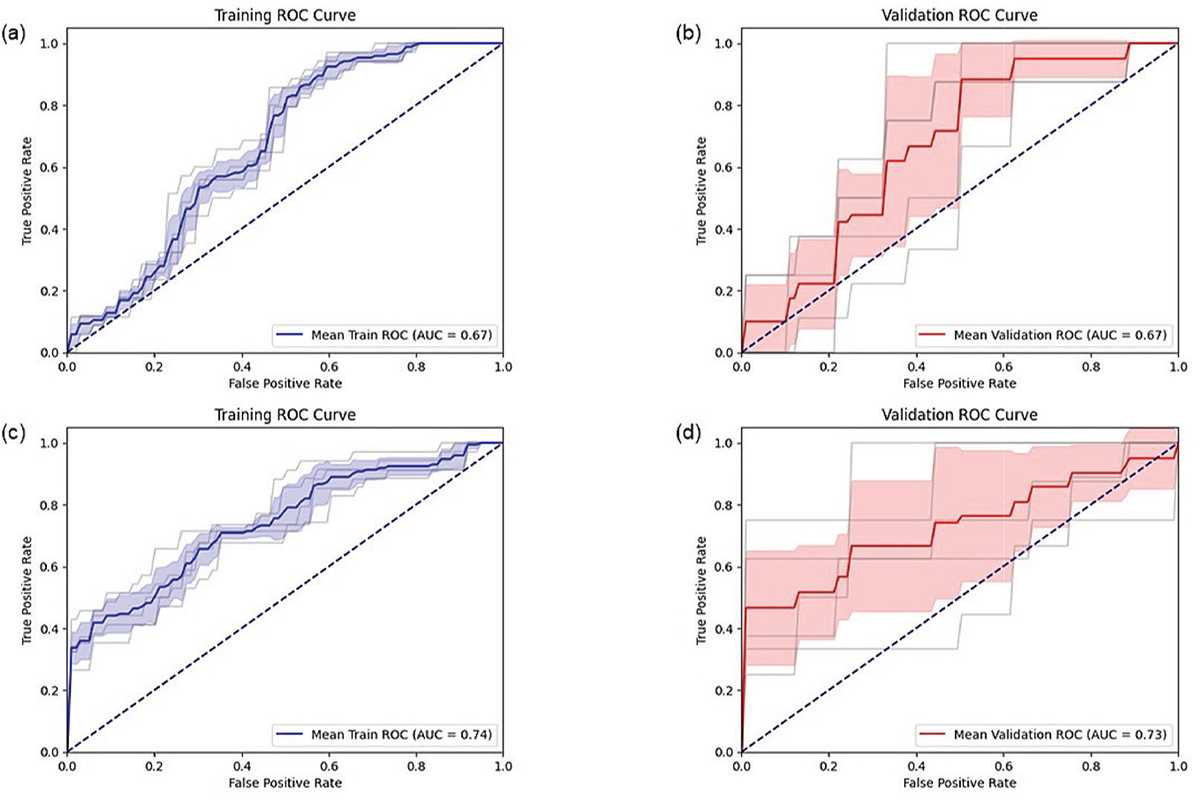
FIGURE 2 - ROC curves for training (a) and validation (b) folds of LDLJaAP, and for training (c) and validation (d) folds of LDLJaML.
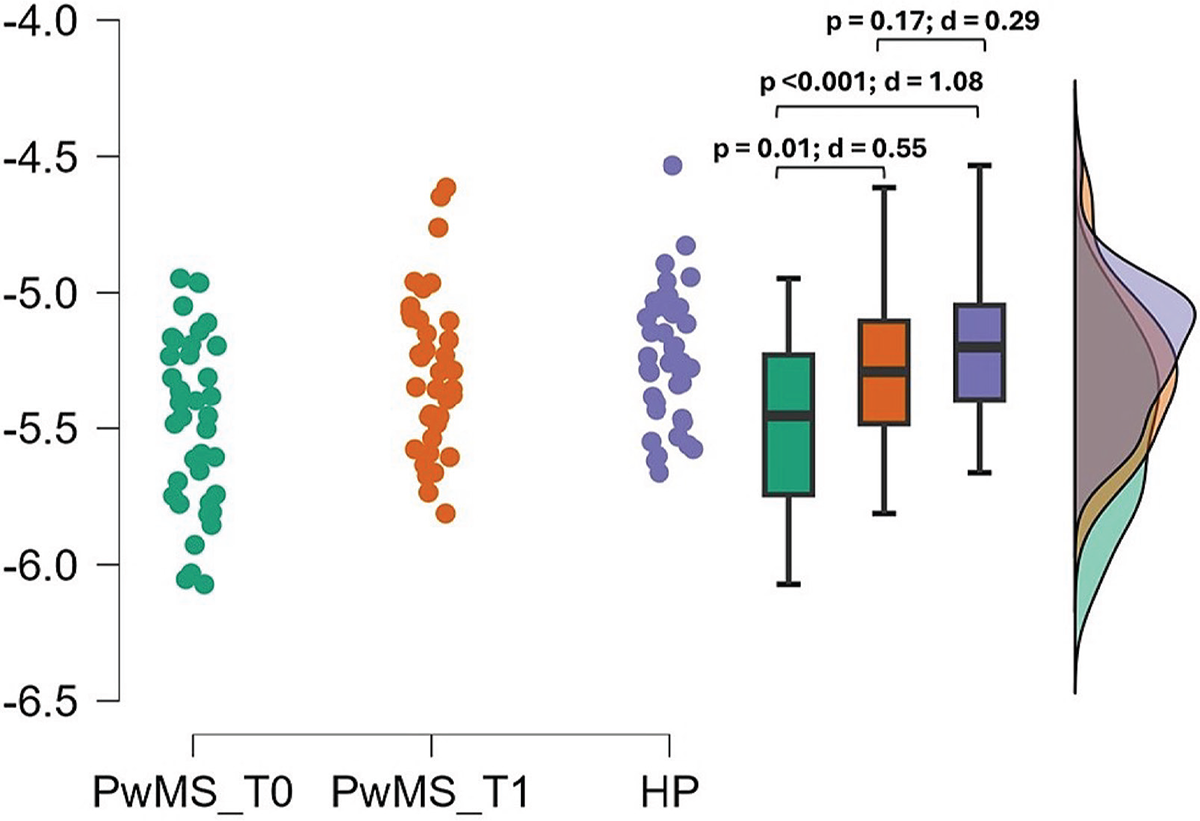
FIGURE 3 - Improvements in LDLJaML between T0 and T1.
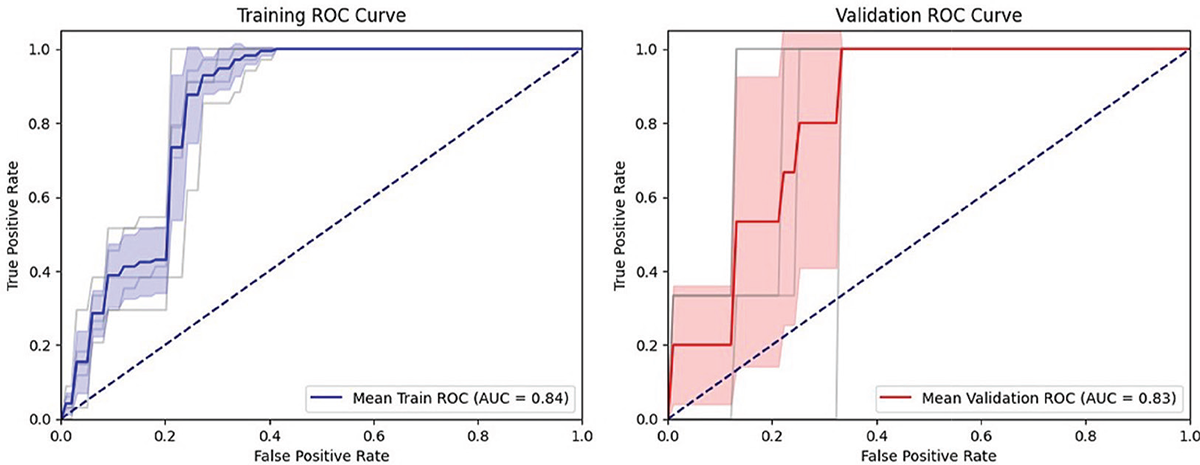
FIGURE 4 - Responsiveness of ΔLDLJaML.
| AUC (95% CI) |
MCID | Se (95% CI) |
Sp (95% CI) |
F1 score (95% CI) |
LR+ (95% CI) |
LR- (95% CI) |
PTP+ (95% CI) |
PTP- (95% CI) |
|
|---|---|---|---|---|---|---|---|---|---|
| Training folds |
0.84 (0.81–0.87) |
> 4.02% | 0.95 (0.87–0.99) |
0.74 (0.87–0.99) |
0.86 (0.81 – 0.90) |
3.76 (3.34 – 4.26) |
0.07 (0.01–0.14) |
57% (54%–60%) |
2% (0%–5%) |
| Validation folds |
0.83 (0.70–0.96) |
0.80 (0.60–0.99) |
0.65 (0.49–0.87) |
0.55 (0.14 – 0.96) |
3.16 (1.12–5.60) |
0.30 (0.00–0.90) |
53% (28%–66%) |
10% (0%–24%) |
Discussion
The purpose of this study was to investigate the ability of the LDLJa to characterize gait differences in PwMS compared to HP, regardless of age or gait speed, and to assess its responsiveness to rehabilitation in terms of its ability to detect clinically meaningful improvements in movement smoothness following rehabilitation. We found significant differences in LDLJa values in the three anatomical directions (antero-posterior, medio-lateral and cranio-caudal) between PwMS and HP, regardless of age and gait speed, with lower LDLJa values indicating gait smoothness reductions in PwMS (Table 2). However, only LDLJaAP and LDLJaML showed sufficient – to – moderate ability to characterize the gait abnormalities of PwMS, as resulted from AUCs nearing 0.70. The OCP for classifying PwMS was found to be less than -4.88 for the AP direction and -5.40 for the ML direction, with a probability to correctly identify persons with MS at the OCP of around 63% to 76%, respectively. These cutoff values discriminate well also in unknown samples, as confirmed by the results in the validation folds set in the cross-validation model, thus increasing the external validity of the results (Table 2). Performance metrics were consistent across the training and validation samples, thus confirming the robustness of the model. As a result, LDLJaAP and LDLJaML can be considered as accurate metrics for identifying gait abnormalities in PwMS, consistent with previous studies highlighting the importance of gait smoothness in this population also in the early stages of the disease (16). Furthermore, LDLJaML positively correlated with MiniBesTest scores, with higher smoothness in medio–lateral direction reflecting higher dynamic postural control. Overall, these results highlight that PwMS experience an abruption of trunk smoothness during gait, and that lower smoothness in medio–lateral direction correlates with balance issues. This is consistent with the reported increased ML sway in the PwMS group, reflecting a reduced ability to control side-to-side motion when compared to controlling antero-posterior sway (40-42).
Nevertheless, only LDLJaML showed significant improvements following rehabilitation, and ΔLDLJaML moderately correlated with ΔMini-BESTest (ρ = 0.54). A greater improvement than 4.02% in LDLJaML was identified as the MCID for reflecting clinically meaningful improvements in smoothness. The AUC for responsiveness was approximately 0.80, reinforcing the utility of LDLJaML as a responsive measure for tracking rehabilitation outcomes, with consistent results between training and test performance metrics. Conversely, Gulde and colleagues (43) reported gait speed, but not smoothness to change following rehabilitation in a similar PwMS sample. However, the discrepancies in smoothness results can rely on the different metrics used for quantifying gait smoothness, namely the spectral arc length and the signal–to–noise ratio instead of LDLJ, which better discriminates smoothness of gait compared with other metrics (24). Moreover, Gulde and colleagues employed the 10- and 6-minute walking tests, instructing participants to walk at their maximal gait speed, which complicates the comparison with our results. Noteworthy, participants in the study by Gulde and colleagues (44) underwent a scheduled multidisciplinary rehabilitation treatment, whereas, in our study, PwMS performed a rehabilitation program specifically focused on dynamic postural stability, which could partially explain the contradictory results between the two studies. Smoothness during comfortable and fast walking speeds may engage distinct neuromuscular strategies. Comfortable walking prioritizes efficiency and balance, which aligns with improvements captured by the Mini-BEST, a tool focused on dynamic balance. In contrast, fast walking emphasizes propulsion and endurance, potentially overshadowing improvements in smoothness. While the 10-meter walk test provides a snapshot of walking patterns over short distances relevant to daily activities (45,46), it may not fully encompass the broader ecological context of community ambulation, particularly in populations with greater disability levels (e.g., EDSS > 4). Tests like the 2-minute or 6-minute walk test are better suited for evaluating endurance and community mobility. Future studies could integrate longer walking tests to better capture endurance-related parameters and their interaction with smoothness in a broader ecological context. The findings of our study have significant clinical implications. The established MCID for LDLJaML provides clinicians with a quantifiable target for rehabilitation interventions aimed at improving gait smoothness in PwMS. Anchoring the Mini-BESTest, a widely used clinical scale for balance assessment, bridges the gap between quantitative gait analysis and clinical practice. This enhances the interpretability and clinical relevance of LDLJaML, facilitating its integration into routine clinical assessments and personalized rehabilitation programs. To our knowledge, no clinical scales specifically assess gait smoothness, a dynamic motor ability reflecting the efficiency of neuromuscular control during movement. The Mini-BEST was chosen as an anchor due to its focus on dynamic balance, which shares underlying mechanisms with smoothness, such as postural control and motor coordination. However, this approach has limitations, as the Mini-BEST primarily evaluates dynamic balance. Furthermore, the robustness of our findings is supported by the applied statistical procedure, including the use of stratified k-fold cross-validation and data balancing techniques to address class imbalance (6). The consistency of performance metrics across training and test sets indicates the reliability and generalizability of our logistic regression models, thus supporting the external validity of the results. The relatively small sample size led to an undersized test set, which contributed to some variability in the validation fold results. Nevertheless, the consistency of performance metrics across training and validation sets supports the reliability and generalizability of our logistic regression models, reinforcing the external validity of the findings. To further validate and refine the MCID thresholds for gait smoothness, larger pragmatic multicenter studies are needed (14). Despite the promising results, the following limitations should be considered. The sample size, though adequate for initial validation, limits the generalizability of the findings. Furthermore, although the abnormal gait pattern in PwMS is independent of the disease phenotype (47), this study did not account for heterogeneity in the sample’s walking ability, as well as MS subtypes and impairment levels.
Additionally, the study focused on a specific cohort of PwMS undergoing a new dynamic rehabilitative approach, which may not reflect conventional treatments. Future research should explore the longitudinal stability of LDLJaML measurements and their predictive value for long-term clinical outcomes. Integrating additional sensor-based gait parameters could provide a more comprehensive assessment of gait abnormalities and their response to rehabilitation. Moreover, utilizing multiple inertial sensors can enhance the collection of kinematic data, offering a more detailed analysis of movement patterns.
Conclusions
Lower LDLJa values in the AP and ML directions characterize the impairment in smoothness of gait in PwMS, compared to HP, regardless of age and gait speed. These differences indicate reduced smoothness, which is associated with compromised balance control. Furthermore, LDLJa in the medio–lateral direction can be considered as a responsive metric to balance–focused rehabilitation interventions, thus highlighting the potential of LDLJa to serve as a reliable and responsive measure for characterizing gait disorders and tracking rehabilitation progress in PwMS. These insights contribute to the development of targeted, data-driven rehabilitation strategies aimed at enhancing balance and gait in PwMS.
Disclosures
Conflict of interest: The authors declare no conflict of interest.
Financial support: This research received no external fundings.
Author’s contributors role: Conceptualization: MT, SFC, FDF. Methodology: MT, SFC, FDF. Data curation: SFC, DT, MS, MT. Formal analysis: SFC, DT, MS, MT. Investigation: SFC, FDF, MT. Writing-original draft: SFC, FDF, MT. Writing-review and editing: all the authors. Supervision: AT, EB, MT.
Data availability statement: The data presented in this study are available upon reasonable request to the corresponding author.
References
- 1. Comber L, Galvin R, Coote S. Gait deficits in people with multiple sclerosis: A systematic review and meta-analysis. Gait Posture. 2017;51:25-35. CrossRef PubMed
- 2. Gunn H, Creanor S, Haas B, Marsden J, Freeman J. Risk factors for falls in multiple sclerosis: an observational study. Mult Scler. 2013;19(14):1913-1922. CrossRef PubMed
- 3. Galperin I, Mirelman A, Schmitz-Hübsch T, et al. Treadmill training with virtual reality to enhance gait and cognitive function among people with multiple sclerosis: a randomized controlled trial. J Neurol. 2023;270(3):1388-1401. CrossRef PubMed
- 4. Corrini C, Gervasoni E, Perini G, et al. Mobility and balance rehabilitation in multiple sclerosis: A systematic review and dose-response meta-analysis. Mult Scler Relat Disord. 2023;69:104424. CrossRef PubMed
- 5. Gordt K, Gerhardy T, Najafi B, Schwenk M. Effects of Wearable Sensor-Based Balance and Gait Training on Balance, Gait, and Functional Performance in Healthy and Patient Populations: A Systematic Review and Meta-Analysis of Randomized Controlled Trials. Gerontology. 2018;64(1):74-89. CrossRef PubMed
- 6. Trabassi D, Castiglia SF, Bini F, et al. Optimizing Rare Disease Gait Classification through Data Balancing and Generative AI: Insights from Hereditary Cerebellar Ataxia. Sensors (Basel). 2024;24(11):3613. CrossRef
- 7. Belluscio V, Bergamini E, Tramontano M, et al. Gait Quality Assessment in Survivors from Severe Traumatic Brain Injury: An Instrumented Approach Based on Inertial Sensors. Sensors (Basel). 2019;19(23):5315. CrossRef PubMed
- 8. Tramontano M, Orejel Bustos AS, Montemurro R, et al. Dynamic Stability, Symmetry, and Smoothness of Gait in People with Neurological Health Conditions. Sensors (Basel). 2024;24(8):2451. CrossRef PubMed
- 9. Buckley C, Galna B, Rochester L, Mazzà C. Upper body accelerations as a biomarker of gait impairment in the early stages of Parkinson’s disease. Gait Posture. 2019;71:289-295. CrossRef PubMed
- 10. Castiglia SF, Trabassi D, Tatarelli A, et al. Identification of Gait Unbalance and Fallers Among Subjects with Cerebellar Ataxia by a Set of Trunk Acceleration-Derived Indices of Gait. Cerebellum. 2023;22(1):46-58. CrossRef PubMed
- 11. Castiglia SF, Tatarelli A, Trabassi D, et al. Ability of a Set of Trunk Inertial Indexes of Gait to Identify Gait Instability and Recurrent Fallers in Parkinson’s Disease. Sensors (Basel). 2021;21(10):3449. CrossRef
- 12. Tramontano M, Manzari L, Bustos ASO, et al. Instrumental assessment of dynamic postural stability in patients with unilateral vestibular hypofunction during straight, curved, and blindfolded gait. Eur Arch Otorhinolaryngol. 2024;281(1):83-94. CrossRef PubMed
- 13. Spain RI, St George RJ, Salarian A, et al. Body-worn motion sensors detect balance and gait deficits in people with multiple sclerosis who have normal walking speed. Gait Posture. 2012;35(4):573-578. CrossRef PubMed
- 14. Angelini L, Carpinella I, Cattaneo D, et al. Is a Wearable Sensor-Based Characterisation of Gait Robust Enough to Overcome Differences Between Measurement Protocols? A Multi-Centric Pragmatic Study in Patients with Multiple Sclerosis. Sensors (Basel). 2019;20(1):79. CrossRef
- 15. Melendez-Calderon A, Shirota C, Balasubramanian S. Estimating Movement Smoothness From Inertial Measurement Units. Front Bioeng Biotechnol. 2021;8:558771. CrossRef
- 16. Pau M, Mandaresu S, Pilloni G, et al. Smoothness of gait detects early alterations of walking in persons with multiple sclerosis without disability. Gait Posture. 2017;58:307-309. CrossRef PubMed
- 17. Tramontano M, Belluscio V, Bergamini E, et al. Vestibular Rehabilitation Improves Gait Quality and Activities of Daily Living in People with Severe Traumatic Brain Injury: A Randomized Clinical Trial. Sensors (Basel). 2022;22(21):8553. CrossRef
- 18. Germanotta M, Iacovelli C, Aprile I. Evaluation of Gait Smoothness in Patients with Stroke Undergoing Rehabilitation: Comparison between Two Metrics. Int J Environ Res Public Health. 2022;19(20):13440. CrossRef
- 19. Miller HL, Templin TN, Fears NE, Sherrod GM, Patterson RM, Bugnariu NL. Movement smoothness during dynamic postural control to a static target differs between autistic and neurotypical children. Gait Posture. 2023;99:76-82. CrossRef PubMed
- 20. Dixon PC, Stirling L, Xu X, Chang CC, Dennerlein JT, Schiffman JM. Aging may negatively impact movement smoothness during stair negotiation. Hum Mov Sci. 2018;60:78-86. CrossRef PubMed
- 21. Suri A, Rosso AL, VanSwearingen J, et al. Mobility of Older Adults: Gait Quality Measures Are Associated With Life-Space Assessment Scores. J Gerontol A Biol Sci Med Sci. 2021;76(10):e299-e306. CrossRef PubMed
- 22. Garcia FDV, da Cunha MJ, Schuch CP, Schifino GP, Balbinot G, Pagnussat AS. Movement smoothness in chronic post-stroke individuals walking in an outdoor environment – A cross-sectional study using IMU sensors. PLoS One. 2021;16(4):e0250100. CrossRef PubMed
- 23. Tramontano M, Argento O, Orejel Bustos AS, et al. Cognitive-motor dual-task training improves dynamic stability during straight and curved gait in patients with multiple sclerosis: a randomized controlled trial. Eur J Phys Rehabil Med. 2024;60(1):27-36. CrossRef PubMed
- 24. Antonelli M, Caselli E, Gastaldi L. Comparison of Gait Smoothness Metrics in Healthy Elderly and Young People. Appl Sci (Basel). 2024;14(2):911. CrossRef
- 25. Husted JA, Cook RJ, Farewell VT, Gladman DD. Methods for assessing responsiveness: a critical review and recommendations. J Clin Epidemiol. 2000;53(5):459-468. CrossRef PubMed
- 26. Crosby RD, Kolotkin RL, Williams GR. Defining clinically meaningful change in health-related quality of life. J Clin Epidemiol. 2003;56(5):395-407. CrossRef PubMed
- 27. Baert I, Freeman J, Smedal T, et al. Responsiveness and clinically meaningful improvement, according to disability level, of five walking measures after rehabilitation in multiple sclerosis: a European multicenter study. Neurorehabil Neural Repair. 2014;28(7):621-631. CrossRef PubMed
- 28. Kurtzke JF. Rating neurologic impairment in multiple sclerosis: an expanded disability status scale (EDSS). Neurology. 1983;33(11):1444-1452. CrossRef PubMed
- 29. Franchignoni F, Horak F, Godi M, Nardone A, Giordano A. Using psychometric techniques to improve the Balance Evaluation Systems Test: the mini-BESTest. J Rehabil Med. 2010;42(4):323-331. CrossRef PubMed
- 30. Godi M, Franchignoni F, Caligari M, Giordano A, Turcato AM, Nardone A. Comparison of reliability, validity, and responsiveness of the mini-BESTest and Berg Balance Scale in patients with balance disorders. Phys Ther. 2013;93(2):158-167. CrossRef PubMed
- 31. Yao XI, Wang X, Speicher PJ, et al. Reporting and Guidelines in Propensity Score Analysis: A Systematic Review of Cancer and Cancer Surgical Studies. J Natl Cancer Inst. 2017;109(8):djw323. CrossRef PubMed
- 32. Huijben B, van Schooten KS, van Dieën JH, Pijnappels M. The effect of walking speed on quality of gait in older adults. Gait Posture. 2018;65:112-116. CrossRef PubMed
- 33. Lowry KA, Vanswearingen JM, Perera S, Studenski SA, Brach JS. Walking smoothness is associated with self-reported function after accounting for gait speed. J Gerontol A Biol Sci Med Sci. 2013;68(10):1286-1290. CrossRef PubMed
- 34. Trojaniello D, Cereatti A, Pelosin E, et al. Estimation of step-by-step spatio-temporal parameters of normal and impaired gait using shank-mounted magneto-inertial sensors: application to elderly, hemiparetic, parkinsonian and choreic gait. J Neuroeng Rehabil. 2014;11:152. CrossRef
- 35. Bergamini E, Ligorio G, Summa A, Vannozzi G, Cappozzo A, Sabatini AM. Estimating orientation using magnetic and inertial sensors and different sensor fusion approaches: accuracy assessment in manual and locomotion tasks. Sensors (Basel). 2014;14(10):18625-18649. CrossRef
- 36. Jiang D, Huang J, Zhang Y. The cross-validated AUC for MCP-logistic regression with high-dimensional data. Stat Methods Med Res. 2013;22(5):505-518. CrossRef PubMed
- 37. Eertink JJ, Heymans MW, Zwezerijnen GJC, Zijlstra JM, de Vet HCW, Boellaard R. External validation: a simulation study to compare cross-validation versus holdout or external testing to assess the performance of clinical prediction models using PET data from DLBCL patients. EJNMMI Res. 2022;12(1):58. CrossRef
- 38. Szeghalmy S, Fazekas A. A Comparative Study of the Use of Stratified Cross-Validation and Distribution-Balanced Stratified Cross-Validation in Imbalanced Learning. Sensors (Basel). 2023;23(4):2333. CrossRef
- 39. Kohavi R. A study of cross-validation and bootstrap for accuracy estimation and model selection; Proceedings of the 14th International Joint Conference on Artificial Intelligence (IJCAI’95); Montreal, QC, Canada. 20–25 August 1995; pp. 1137-1145. CrossRef
- 40. Forman G, Scholz M. Apples-to-apples in cross-validation studies: pitfalls in classifier performance measurement. SIGKDD Explor. 2010;12(1):49-57. CrossRef
- 41. Morrison S, Rynders CA, Sosnoff JJ. Deficits in medio-lateral balance control and the implications for falls in individuals with multiple sclerosis. Gait Posture. 2016;49:148-154. CrossRef PubMed
- 42. Comber L, Sosnoff JJ, Galvin R, Coote S. Postural control deficits in people with Multiple Sclerosis: A systematic review and meta-analysis. Gait Posture. 2018;61:445-452. CrossRef PubMed
- 43. Lencioni T, Anastasi D, Carpinella I, et al. Strategies for maintaining dynamic balance in persons with neurological disorders during overground walking. Proc Inst Mech Eng H. 2021;235(9):1079-1087. CrossRef PubMed
- 44. Gulde P, Hermsdörfer J, Rieckmann P. Speed but Not Smoothness of Gait Reacts to Rehabilitation in Multiple Sclerosis. Mult Scler Int. 2021;2021:5589562. Published 2021 Jun 3. CrossRef
- 45. Paltamaa J, Sarasoja T, Leskinen E, Wikström J, Mälkiä E. Measures of physical functioning predict self-reported performance in self-care, mobility, and domestic life in ambulatory persons with multiple sclerosis. Arch Phys Med Rehabil. 2007;88(12):1649-1657. CrossRef PubMed
- 46. Kieseier, B. C., & Pozzilli, C. Assessing walking disability in multiple sclerosis. Multiple sclerosis 2012 (Houndmills, Basingstoke, England), 18(7), 914-924. CrossRef
- 47. Dujmovic I, Radovanovic S, Martinovic V, et al. Gait pattern in patients with different multiple sclerosis phenotypes. Mult Scler Relat Disord. 2017;13:13-20. CrossRef PubMed